
Application of airborne LiDAR technology in geological hazard investigation in Huangpu District, Guangzhou City
-
摘要:
近年来,机载LiDAR技术快速发展,其能够“穿透”地面植被,获取地面真实高程,对于精准获取地质灾害隐患点具有重要意义。为查明广州黄埔区地质灾害发育特征,文章基于机载LiDAR技术获取了黄埔区总面积为526.5 km2的三维点云和数字正射影像等数据,结合传统人工现场调查手段,查明项目范围内的典型地质灾害发育特征。解译结果表明:调查区内地质灾害呈面状和线状分布,主要集中在中北部山区丘陵地带,其他地区零星分布或无分布,崩塌及危岩体类地质灾害435处、滑坡及不稳定斜坡类地质灾害
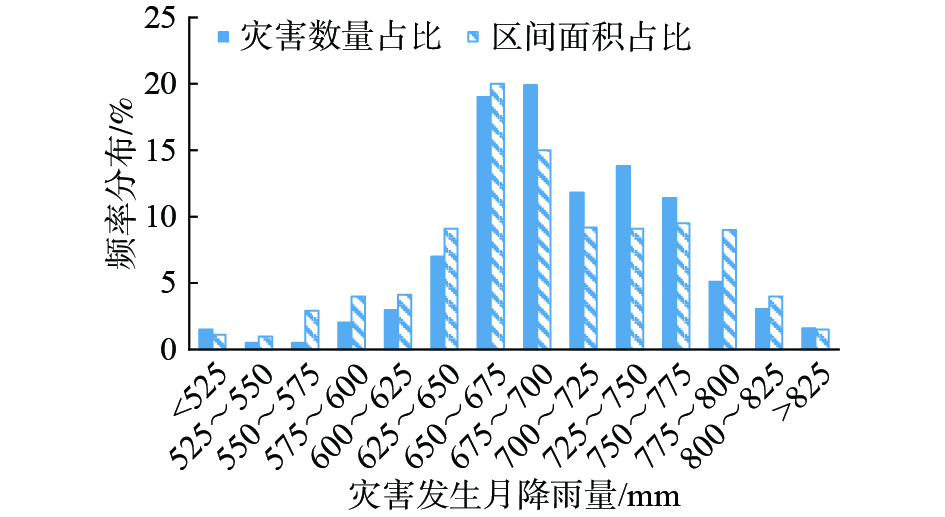
1027 处,极端天气情况下可能诱发的低频泥石流灾害66处,以滑坡及不稳定斜坡类灾害为主;此外,区内地质灾害发育规律与地形地貌、地质条件、工程活动及降雨等因素具有较强的关联性,其中降雨诱发地质灾害较为显著,灾害多发生在月降雨量650~700 mm区间。研究表明,机载LiDAR技术能够实现研究区内地质灾害的识别,对指导识灾避灾减灾工作具有较好的指导作用和应用价值。Abstract:In recent years, airborne LiDAR technology has developed rapidly, allowing for the penetration of ground vegetation and the accurate acquisition of ground elevation, which is of great significance for precisely identifying geological hazard points. In order to understand the development characteristics of geological disasters in Huangpu District, Guangzhou, this study utilized airborne LiDAR technology to obtain three-dimensional point cloud and digital orthophoto images covering a total area of 526.5 km2 within district. Combined with traditional manual field investigation methods, the study identified the typical geological disaster development characteristics within the project scope. The interpretation results indicate that geological disasters within the investigation area are distributed in both surface and linear patterns, mainly concentrated in the hilly areas of the central and northern parts, with scattered or no distribution in other areas. There are 435 instances of geological disasters such as collapses and dangerous rock masses,
1027 instances of geological disasters such as landslides and unstable slopes, and 66 instances of low-frequency debris flow disasters that may be induced under extreme weather conditions, with landslides and unstable slope disasters being predominant. Additionally, the development pattern of geological disasters in the area exhibits a strong correlation with topography, geological conditions, engineering activities, and rainfall. Rainfall is notably significant in inducing geological hazards, with disasters occurring mainly within the range of monthly rainfall between 650 and 700 mm. The study demonstrates that airborne LiDAR technology can achieve the identification of geological disasters within the study area, providing valuable guidance and application value for guiding disaster identification, prevention, mitigation, and management. -
0. 引言
查明与地质灾害有关的危险区域是地质灾害管理的重要工作,也是促进研究区人民生活和基础设施发展安全的重要依据[1],基于建模评价地质灾害易发性是重要而且有效的途径。
应用经验式、数值模拟和统计方法对地质灾害易发性建模和评价,已经进行了许多研究[1-10]。其中,经验式方法基于现场观察和专家经验判断;数值模拟计算边坡的稳定性;统计方法部分基于实地观察和专家的先验知识,部分基于对地质灾害发生的权重或概率的统计计算,这类方法使用统计技术来评估诱发地质灾害的各种因素的相关作用,每个因素的重要性都是根据观察到的与地质灾害的关系来确定的。
文中使用基于贝叶斯理论的证据权法,综合GIS技术评价研究区地质灾害易发性。证据权法是一种统计方法,最初应用于非空间、定量的医学诊断,以结合临床诊断的证据来预测疾病[11-12]。在地球科学中,该方法被广泛应用,如:矿产资源潜力评估和矿床预测[13-16],公路路基岩溶塌陷危险性评价[17]和滑坡易发性和危险性[1, 3, 18-23]。
1. 研究区和数据
1.1 研究区概况
文中选择云南高原滇中昆明盆地低山丘陵地带这一云南省地质灾害防治重点地区的典型代表,云南省省会昆明市的主要行政区之一,昆明市五华区作为研究对象,该区地质灾害易发性评价研究具有典型代表性,可向整个云南高原昆明盆地低山丘陵区和其他低山丘陵区推广,具有技术方法和社会经济意义。研究区面积381.6 km2,地势西北高东南低,昆明盆地内地形开阔低缓,北部山区地形崎岖,沟壑较发育。区域年降水量的80%以上集中在6—9月,年平均降水量608.4~887.0 mm。碳酸盐岩分布最广,约占全区面积的38.93%,其次为砂岩、泥岩、页岩,约占23.11%,岩浆岩主要为玄武岩,约占16.95%,主要分布在昆明盆地和其他小盆地的松散碎石土体约占11.36%,石英砂岩类约占7.56%,还发育一些岩脉;断裂构造较发育,以南北向构造为主[24-25]。
1.2 数据收集
通过地质灾害风险普查获得了研究区地质灾害分布数据。根据调查分析,选择工程地质岩组、断裂构造、高程、坡度、坡向、坡面曲率、距公路距离和土地利用类型等8类因素纳入评价分析。地质数据收集自云南省地质局1∶20万昆明幅、武定幅区域地质调查报告和图件[24-25],12.5 m分辨率DEM(数字高程模型)收集自ASF,道路数据收集自OSM,土地利用类型数据收集自ESA(图1、表1)。
表 1 数据简介Table 1. Data introduction数据 灾点及
致灾要素类型 来源 地灾 地灾点 矢量点 地质灾害风险普查 地质 工程地质岩组 矢量面 云南省地质局 距断裂
距离矢量线和缓冲区 云南省地质局 地形地貌 高程 栅格 12.5 m DEM,
https://asf.alaska.edu/坡度 栅格 根据DEM,应用ArcGIS提取 坡向 栅格 根据DEM,应用ArcGIS提取 坡面曲率 栅格 根据DEM,应用ArcGIS提取 道路 距公路
距离矢量线缓冲区 http://www.openstreetmap.org,
根据矢量线用ArcGIS制作土地利用
类型土地利用
类型栅格 ESA WorldCover 10 m 2020,https://esa-worldcover.org/en 1.3 地质灾害发育特征
现状发育地质灾害89处,滑坡73处,崩塌11处,泥石流4条,地面沉降1处,为小—中型,无大型,中型14处,小型75处,主要分布在研究区低山丘陵地貌区,盆地内仅发育1处(图2)。
![]() 图 2 地质灾害分布图(底图为高程和山体阴影渲染)Figure 2. Map of geological hazard distribution (The bottom was rendered by elevation and hillshade)
图 2 地质灾害分布图(底图为高程和山体阴影渲染)Figure 2. Map of geological hazard distribution (The bottom was rendered by elevation and hillshade)选择指标“因子面积百分比A”“地灾数百分比B”和“比率(β=B/A)”表征地质灾害的空间分布特征、主控因素和成灾特征。β定义了地质灾害点在因素分级中相对于均匀分布的丰度,β>1表示相对丰度更高,β<1则相反。β>1的因素分级有(图3、表2):高程1800~1850 m、1920~1950 m和1950~2000 m,坡度15°~25°、25°~35°和>35°,坡向北东、东、南东和北,坡面曲率−0.75~−0.28(凹形)、−0.28~−0.15(凹形)、−0.15~−0.05(凹形)和0.05~0.15(凸形),石英砂岩岩组和砂岩、泥岩、页岩岩组,距断层距离0~50 m、300~500 m和1000~2000 m,距主要公路距离0~50 m和50~100 m,草地和裸地/稀疏植被区域。这些因素分级内,发育了相对于均匀分布丰度更高的地质灾害,表征这些因素分级可能是研究区地质灾害的主控因素。
![]() 图 3 各因素分级分区和地灾点数量相关性统计图Figure 3. Statistical charts of correlation between the factors and the number of geological hazard points
图 3 各因素分级分区和地灾点数量相关性统计图Figure 3. Statistical charts of correlation between the factors and the number of geological hazard points2. 方法
2.1 权重计算
把研究区栅格单元化,利用条件概率计算证据因素图层所有单元对地质灾害发生的贡献权重[13-15, 26-27]。定义
$ D $ 为已发生地质灾害的单元,$ \bar{D} $ 为未发生地质灾害的单元,$ B $ 为证据因素区内的单元,$ \bar{B} $ 为证据因素区外的单元。证据因素
$ B $ 条件下$ D $ 的条件(后验)概率为:$$ { O}\left(D|B\right)={ O}\left(D\right)\frac{P\left(B\right|D)}{P(B|{\bar D})} $$ (1) 式中:
$ { O}\left(D\right) $ —证据因素B的先验概率,${{ O}}\left(D\right)=$ $\dfrac{\mathrm{事}\mathrm{件}\mathrm{将}\mathrm{会}\mathrm{发}\mathrm{生}\mathrm{的}\mathrm{概}\mathrm{率}}{\mathrm{事}\mathrm{件}\mathrm{不}\mathrm{会}\mathrm{发}\mathrm{生}\mathrm{的}\mathrm{概}\mathrm{率}}=\dfrac{P\left(D\right)}{1-P\left(D\right)}=$ $\dfrac{P\left(D\right)}{P({\bar D})} $ ;$P\left(B\right|D)、 P(B|{\bar D})$ ——在地质灾害发生(D)和未发生 ($ \bar{D} $ )时,证据因素B的条件 概率,取自然对数即是证据 权法中的正权重(证据因素 存在区的权重值)$ {W}^{+} $ 。$$ {W}^+=\ln\frac{P\left(B\right|D)}{P\left(B|{\bar D}\right)} $$ (2) $$ P\left(B|D\right)=P\left(B\cap D\right)/P\left(D\right) $$ (3) $$ P(B|\bar{D})=P(B\cap \bar{D})/P(\bar{D}) $$ (4) 用
$ D $ 和$ B $ 的单元数N可表示为:$$ P\left(B|D\right)=N\left(B\cap D\right)/N\left(D\right) $$ (5) $$ P(B|\bar{D})=N(B\cap \bar{D})/N(\bar{D}) $$ (6) 同式(1),在证据因素不存在的情况下(
$ \bar{B} $ ),$ D $ 的条件概率(后验)为:$$ {{ O}}(D|\bar{B})={{ O}}(D)\frac{P(\bar{B}|D)}{P(\bar{B}|\bar{D})} $$ (7) 式中:
$P(\bar{B}|D)/P(\bar{B}|\bar{D})$ —取自然对数即是负权重(证据 因素不存在区的权重值)$ {W}^{-} $ 。$$ {W}^-={\rm{ln}}\frac{P(\bar{B}|D)}{P(\bar{B}|\bar{D})} $$ (8) 同式(3)—(6):
$$ P(\bar{B}|D)=N(\bar{B}\cap D)/N(D) $$ (9) $$ P(\bar{B}|\bar{D})=N(\bar{B}\cap \bar{D})/N(\bar{D}) $$ (10) $N (B\cap D) + N (\bar{B}\cap D)=N(D)$ ,$N (B\cap \bar{D}) + N (\bar{B}\cap \bar{D})= N(\bar{D})$ ,所以式(2)和式(8)可写为:$$ {W}^+={\rm{ln}}\left(\frac{N(B\cap D)}{N(B\cap D)+N(\bar{B}\cap D)}/\frac{N(B\cap \bar{D})}{N(B\cap \bar{D})+N(\bar{B}\cap \bar{D})}\right) $$ (11) $$ {W}^-={\rm{ln}}\left(\frac{N(\bar{B}\cap D)}{N(B\cap D)+N(\bar{B}\cap D)}/\frac{N(\bar{B}\cap \bar{D})}{N(B\cap \bar{D})+N(\bar{B}\cap \bar{D})}\right) $$ (12) 根据式(11)和(12),使用ArcGIS空间分析工具执行权重
$ {W}^{+} $ 和$ {W}^{-} $ 计算。$ {W}^{+} $ 的大小表明证据因素的存在与地质灾害发生之间存在正相关关系。$ {W}^{-} $ 表示负相关,即证据因素存在抑制诱发地质灾害的作用。证据因素原始数据缺失区域的权重值取0。两个权重之间的差异$ {W}_{{\rm{f}}}={W}^{+}-{W}^{-} $ ,即综合权重,量化证据因素和地质灾害相关性大小。如果$ {W}_{{\rm{f}}} $ 为正,则证据因素对地质灾害有利,如果为负,则对滑坡不利。如果$ {W}_{{\rm{f}}} $ 接近于零,则表明证据因素与地质灾害的相关性不大。2.2 因素分级(分类)的显著性测试
在上述权重值计算及分析的基础上,实施证据因素分类的优选,选择类间差异显著的证据因素类,归并不显著的证据因素类。选择近似学生化检验(Student-T)统计值进行显著性测试[15, 28]:
$$ {S tuden{t}}-{{T}}={W}_{{\rm{f}}}/{\sigma }_{{W}_{{\rm{f}}}}={W}_{{\rm{f}}}/\sqrt{{\sigma }_{{W}^+}^{2}+{\sigma }_{{W}^-}^{2}} $$ (13) 式中:
$ {\sigma }_{{W}^{+}}^{} $ 、$ {\sigma }_{{W}^{-}}^{} $ ——分别是$ {W}^{+} $ 和$ {W}^{-} $ 的标准差;Wf ——综合权重;
${\sigma }_{{W}_{{\rm{f}}}}$ ——综合权重标准差。当测试值的绝对值
$|{S tuden{t}}-{ T}|$ 为1.96和2.326时,置信度达97.5%、99%,文中以$|{S tuden{t}}-{ T}|=2$ 作为阈值。先将证据因素划分为若干分级(分类),计算权重和标准差、${{S} tuden{t}}-{ T}$ ,将$|{S} tuden{t}-{ T} | < 2$ 的各分类视为显著性低并归为一类,保留$|{{S} tuden{t}}-{T}|\geqslant 2$ 的因素分类,然后重新计算归并后各分类的权重值。2.3 证据综合
根据贝叶斯法则,任一单元
$ K $ 为地质灾害的可能性,即对数后验概率可表示为[13-15, 26, 27]:$$ F=\ln O\left(D|\sum _{i=1}^{n}{B}_{i}^{K\left(i\right)}\right)=\sum _{i=0}^{n}{W}_{i}^{K}+\ln O\left(D\right) $$ (14) 式中:
$ {B}_{i} $ ——第$ i $ 个证据因素层;$ K\left(i\right) $ —$ {W}_{i} $ 是第$ i $ 个证据因素存在或不存在的权 重,在第$ i $ 个证据因素层存在时是+,不存在 时是−。最后计算后验概率:
$$ P=O/(1+O)=\exp\left(F\right)/\left(1+\exp\left(F\right)\right) $$ (15) 后验概率的大小作为易发性高低的指标,值越大表示易发性越高,值越小表示易发性越低。
3. 结果与讨论
3.1 证据权重计算结果和相关性分析
证据权重计算结果(表2、图4)与1.3节可相互印证。在地形高程方面,1800~1850 m、1920~1950 m和1950~2000 m段利于地质灾害发生,正权重0.5550、1.1758和0.6439。>35°和15°~25°的山体斜坡较易于地质灾害发生,正权重0.5436和0.3785。坡向因素各分级权重值均不高,表明坡向对地质灾害发生的驱动作用可能不太显著。坡面曲率结果显示,−0.75~−0.28(凹形)和−0.28~−0.15(凹形)两个凹形坡分级段较易于地质灾害发生,正权重0.5690和0.7577。工程地质岩组各岩组分类的正权重值总体不高,但砂岩、泥岩、页岩岩组的统计结果仍然表现出对地质灾害发生的较有利性,其正权重0.4474,高于排在第二位的石英砂岩岩组(正权重值为0.2947)。距断层距离和距主要公路距离因素统计结果均显示出了较明显的距离效应,即距断裂或主要公路远的地区与地质灾害发生负相关,距断裂0~50 m和距主要公路0~50 m、50~100 m易于地质灾害发生,其正权重0.7973、0.9820和0.5111。裸地或稀疏植被地区是易于地质灾害发生的区域,其正权重0.8719。
表 2 因素证据权重计算结果表Table 2. Calculation results of factor evidence weights因素 因素分级 因素面积
百分比/%地灾数
百分比/%正权重
W+W+的
标准差${\sigma }_{{W}^{+}}^{} $负权重W− W−的
标准差${\sigma }_{{W}^{-}}^{} $综合权重
$ {W}_{{\rm{f}}} $$ {W}_{{\rm{f}}} $的
标准差${\sigma }_{{W}_{{\rm{f}}}} $Student−T 分类
归并归并后
权重权重
标准差高程/m <1735 0.01 0.00 0.0000 0.0000 0.0000 0.0000 0.0000 0.0000 0.0000 合并 −0.2744 0.1607 1735~1800 0.36 0.00 0.0000 0.0000 0.0000 0.0000 0.0000 0.0000 0.0000 合并 −0.2744 0.1607 1 800~1 850 0.65 1.12 0.5550 1.0082 −0.0048 0.1071 0.5598 1.0138 0.5522 合并 −0.2744 0.1607 1 850~1 900 9.55 10.11 0.0574 0.3350 −0.0063 0.1123 0.0636 0.3533 0.1801 合并 −0.2744 0.1607 1 900~1 920 6.81 4.49 −0.4186 0.5015 0.0248 0.1090 −0.4434 0.5133 −0.8639 合并 −0.2744 0.1607 1 920~1 950 6.73 21.35 1.1758 0.2329 −0.1720 0.1200 1.3478 0.2620 5.1444 4 1.1758 0.2329 1 950~2 000 12.50 23.60 0.6439 0.2202 −0.1368 0.1218 0.7807 0.2516 3.1032 5 0.6439 0.2202 2 000~2 100 23.25 11.24 −0.7318 0.3169 0.1468 0.1131 −0.8787 0.3365 −2.6110 13 −0.7318 0.3169 2 100~2 200 18.86 20.22 0.0708 0.2369 −0.0172 0.1192 0.0879 0.2652 0.3315 合并 −0.2744 0.1607 2 200~2 300 11.48 4.49 −0.9436 0.5009 0.0767 0.1090 −1.0203 0.5126 −1.9903 合并 −0.2744 0.1607 2 300~2 400 7.02 3.37 −0.7383 0.5786 0.0389 0.1084 −0.7772 0.5887 −1.3201 合并 −0.2744 0.1607 2 400~2 500 2.61 0.00 0.0000 0.0000 0.0000 0.0000 0.0000 0.0000 0.0000 合并 −0.2744 0.1607 >2 500 0.19 0.00 0.0000 0.0000 0.0000 0.0000 0.0000 0.0000 0.0000 合并 −0.2744 0.1607 坡度/(°) <5 18.72 4.49 −1.4297 0.5006 0.1620 0.1091 −1.5916 0.5123 −3.1068 5 −1.4297 0.5006 5~15 38.32 37.08 −0.0288 0.1749 0.0174 0.1343 −0.0462 0.2205 −0.2093 合并 0.0221 0.1450 15~25 28.72 41.57 0.3785 0.1655 −0.2023 0.1392 0.5808 0.2163 2.6853 3 0.3785 0.1655 25~35 11.60 12.36 0.0688 0.3030 −0.0093 0.1138 0.0782 0.3237 0.2416 合并 0.0221 0.1450 >35 2.64 4.49 0.5436 0.5040 −0.0195 0.1090 0.5632 0.5157 1.0921 合并 0.0221 0.1450 坡向 北东 9.72 11.24 0.1460 0.3179 −0.0171 0.1130 0.1631 0.3374 0.4833 合并 −0.0001 0.1065 东 12.77 15.73 0.2107 0.2688 −0.0349 0.1160 0.2456 0.2928 0.8388 合并 −0.0001 0.1065 南东 16.92 19.10 0.1222 0.2438 −0.0268 0.1184 0.1490 0.2710 0.5496 合并 −0.0001 0.1065 南 13.16 11.24 −0.1592 0.3175 0.0221 0.1130 −0.1813 0.3370 −0.5379 合并 −0.0001 0.1065 南西 10.57 10.11 −0.0448 0.3348 0.0052 0.1123 −0.0500 0.3532 −0.1415 合并 −0.0001 0.1065 西 13.45 6.74 −0.6954 0.4092 0.0754 0.1103 −0.7707 0.4238 −1.8186 合并 −0.0001 0.1065 北西 14.58 12.36 −0.1667 0.3027 0.0259 0.1138 −0.1926 0.3234 −0.5955 合并 −0.0001 0.1065 北 8.82 13.48 0.4290 0.2908 −0.0529 0.1145 0.4819 0.3125 1.5423 合并 −0.0001 0.1065 坡面
曲率−0.75~−0.28(凹形) 3.20 5.62 0.5690 0.4509 −0.0255 0.1096 0.5945 0.4640 1.2812 合并 0.0960 0.1367 −0.28~−0.15(凹形) 10.64 22.47 0.7577 0.2258 −0.1432 0.1209 0.9009 0.2562 3.5171 1 0.7577 0.2258 −0.15~−0.05(凹形) 19.66 26.97 0.3197 0.2054 −0.0962 0.1246 0.4159 0.2403 1.7311 合并 0.0960 0.1367 −0.05~0.05(平坦) 34.18 16.85 −0.7119 0.2588 0.2362 0.1169 −0.9482 0.2840 −3.3388 6 −0.7119 0.2588 0.05~0.15(凸形) 17.53 21.35 0.1990 0.2307 −0.0478 0.1201 0.2468 0.2601 0.9489 合并 0.0960 0.1367 0.15~0.28(凸形) 11.00 5.62 −0.6766 0.4483 0.0593 0.1097 −0.7359 0.4615 −1.5945 合并 0.0960 0.1367 0.28~0.69(凸形) 3.78 1.12 −1.2194 1.0014 0.0275 0.1071 −1.2469 1.0071 −1.2381 合并 0.0960 0.1367 工程
地质
岩组松散碎石土体 13.15 6.74 −0.6736 0.4092 0.0720 0.1103 −0.7456 0.4238 −1.7592 合并 −0.1844 0.1329 石英砂岩 7.55 10.11 0.2947 0.3354 −0.0283 0.1123 0.3230 0.3537 0.9131 合并 −0.1844 0.1329 砂岩、泥岩、页岩 23.08 35.96 0.4474 0.1781 −0.1844 0.1330 0.6318 0.2222 2.8430 3 0.4474 0.1781 白云岩、灰岩 38.88 37.08 −0.0491 0.1749 0.0301 0.1343 −0.0793 0.2205 −0.3596 合并 −0.1844 0.1329 玄武岩 16.94 10.11 −0.5206 0.3343 0.0800 0.1124 −0.6005 0.3526 −1.7029 合并 −0.1844 0.1329 侵入岩脉 0.29 0.00 0.0000 0.0000 0.0000 0.0000 0.0000 0.0000 0.0000 合并 −0.1844 0.1329 距断层
距离/m0~50 5.63 12.36 0.7973 0.3046 −0.0746 0.1137 0.8719 0.3252 2.6814 3 0.7973 0.3046 50~100 5.86 5.62 −0.0429 0.4492 0.0026 0.1096 −0.0455 0.4624 −0.0985 合并 −0.0746 0.1137 100~300 19.87 19.10 −0.0397 0.2436 0.0096 0.1184 −0.0493 0.2709 −0.1822 合并 −0.0746 0.1137 300~500 16.11 20.22 0.2299 0.2371 −0.0508 0.1192 0.2806 0.2654 1.0574 合并 −0.0746 0.1137 500~1000 26.12 17.98 −0.3764 0.2508 0.1056 0.1177 −0.4820 0.2770 −1.7397 合并 −0.0746 0.1137 1000~2 000 22.75 24.72 0.0840 0.2143 −0.0261 0.1227 0.1101 0.2469 0.4457 合并 −0.0746 0.1137 >2000 3.66 0.00 0.0000 0.0000 0.0000 0.0000 0.0000 0.0000 0.0000 合并 −0.0746 0.1137 距主要
公路
距离/m0~50 11.11 29.21 0.9820 0.1986 −0.2296 0.1265 1.2116 0.2354 5.1469 3 0.9820 0.1986 50~100 8.14 13.48 0.5111 0.2909 −0.0605 0.1145 0.5716 0.3126 1.8284 合并 −0.1257 0.1296 100~300 20.62 20.22 −0.0196 0.2368 0.0050 0.1192 −0.0247 0.2651 −0.0931 合并 −0.1257 0.1296 300~500 12.53 3.37 −1.3195 0.5781 0.1005 0.1084 −1.4201 0.5882 −2.4144 4 −1.3195 0.5781 500~1000 17.21 16.85 −0.0210 0.2594 0.0043 0.1168 −0.0253 0.2845 −0.0889 合并 −0.1257 0.1296 1000~2 000 16.67 10.11 −0.5038 0.3343 0.0765 0.1124 −0.5803 0.3527 −1.6455 合并 −0.1257 0.1296 >2000 13.72 6.74 −0.7153 0.4092 0.0785 0.1103 −0.7939 0.4238 −1.8733 合并 −0.1257 0.1296 土地
利用
类型林地 54.70 28.09 −0.0794 0.1497 0.0883 0.1515 −0.1676 0.2130 −0.7870 合并 −0.1287 0.1183 灌木 0.14 0.00 0.0000 0.0000 0.0000 0.0000 0.0000 0.0000 0.0000 合并 −0.1287 0.1183 草地 7.39 8.99 0.1979 0.3556 −0.0176 0.1116 0.2155 0.3727 0.5783 合并 −0.1287 0.1183 耕地 16.54 10.11 −0.4955 0.3343 0.0749 0.1124 −0.5704 0.3527 −1.6174 合并 −0.1287 0.1183 建筑 12.82 11.24 −0.1332 0.3175 0.0182 0.1130 −0.1514 0.3370 −0.4492 合并 −0.1287 0.1183 裸地或稀疏植被 8.09 41.57 0.8719 0.2452 −0.1287 0.1183 1.0006 0.2723 3.6746 4 0.8719 0.2452 开阔水域 0.32 0.00 0.0000 0.0000 0.0000 0.0000 0.0000 0.0000 0.0000 合并 −0.1287 0.1183 3.2 模型ROC曲线和AUC
采用接受者操作特性曲线(Receiver Operating Characteristic Curve,ROC)和ROC 曲线下与坐标轴围成的面积(Area Under Curve,AUC)[29-32]评估模型拟合精度。模型拟合精度越好则AUC越接近1,0.7~0.9时表示较好。文中建立的证据权法模型的AUC为80.4%,拟合精度优异(图5)。
3.3 易发性评价结果
综合自然间断点分级和地质灾害分布,圈定了高易发区、中易发区和低易发区(表3、图6),其中高易发区188.55 km2(占研究区总面积的49.41%),中易发区152.21 km2(占研究区总面积的39.88%),89.9%和9.1%的地灾点落入高易发区和中易发区,显示易发性分区符合已发地质灾害分布,模型预测性能较好。
表 3 地质灾害易发性分区表Table 3. Form of geological hazard susceptibility zoning易发性
分区面积/
km2占总面积/
%编号 面积/
km2占大区/
面积%灾点数 灾点密度/
(个·km−2)地质灾害
高易发区(Ⅰ)188.55 49.41 Ⅰ1 152.32 80.79 64 0.41 Ⅰ2 17.93 9.51 9 0.50 Ⅰ3 16.11 8.54 8 0.94 Ⅰ4 2.19 1.16 1 0.46 地质灾害
中易发区(Ⅱ)152.21 39.88 Ⅱ1 1.30 0.85 − − Ⅱ2 18.82 12.36 2 0.11 Ⅱ3 15.03 9.87 1 0.07 Ⅱ4 12.92 8.49 − − Ⅱ5 18.51 12.16 2 0.11 Ⅱ6 9.12 5.99 − − Ⅱ7 44.66 29.34 − − Ⅱ8 12.34 8.11 1 0.08 Ⅱ9 11.73 7.71 − − Ⅱ10 7.78 5.11 − − 低易发区(Ⅲ) 47.40 12.42 Ⅲ1 47.40 100 1 0.02 结合地质环境因素特征分析西部高易发区(图6蓝色框范围内、图7)主要位于砂岩、泥岩和页岩岩组,断裂构造较密集,以山谷斜坡地貌为主,坡度15°~25°和>35°较陡峭斜坡范围成片发育且面积较广,主要公路建于本区山谷,裸地/稀疏植被和草地连片覆盖范围较大。预测圈定的高易发区的这些分布特征,与上文分析得到的地质灾害控制因素特征吻合,预测结果符合地质灾害空间分布特征。
4. 结论
(1)“因子面积百分比A”“地灾数百分比B”和“比率β”,以及各因素各分类地质灾害证据权重可以定量地分析各因素与地质灾害发生的相关性。
(2)圈定高易发区188.55 km2(占总面积的49.41%),中易发区152.21 km2(占总面积的39.88%),易发性分区图具有较好的等级区分度。
(3)通过证据权法绘制的地质灾害易发性图可以有效地预测该区地质灾害,模型拟合精度AUC=80.4%。89.9%和9.1%的地灾点落入高和中易发区,建模结果与实际地质灾害发育情况吻合度高,较好地揭示了研究区地质灾害易发性特征。
(4)证据权法在研究区这类云南高原低山丘陵区有效性高,方法理论清晰,较为成熟,由数据驱动,参数定义明确,易于一线工程师推广使用。同时,该方法权重的估计和模型预测性能受预测因子选择、因子数据空间分辨率、因子分级影响较大,具体工作中宜对这些问题进行深入研究和统计分析。建议通过对因子分级进行显著性测试实施优选,减小对权重的高估或低估,提高模型效能。
-
![]()
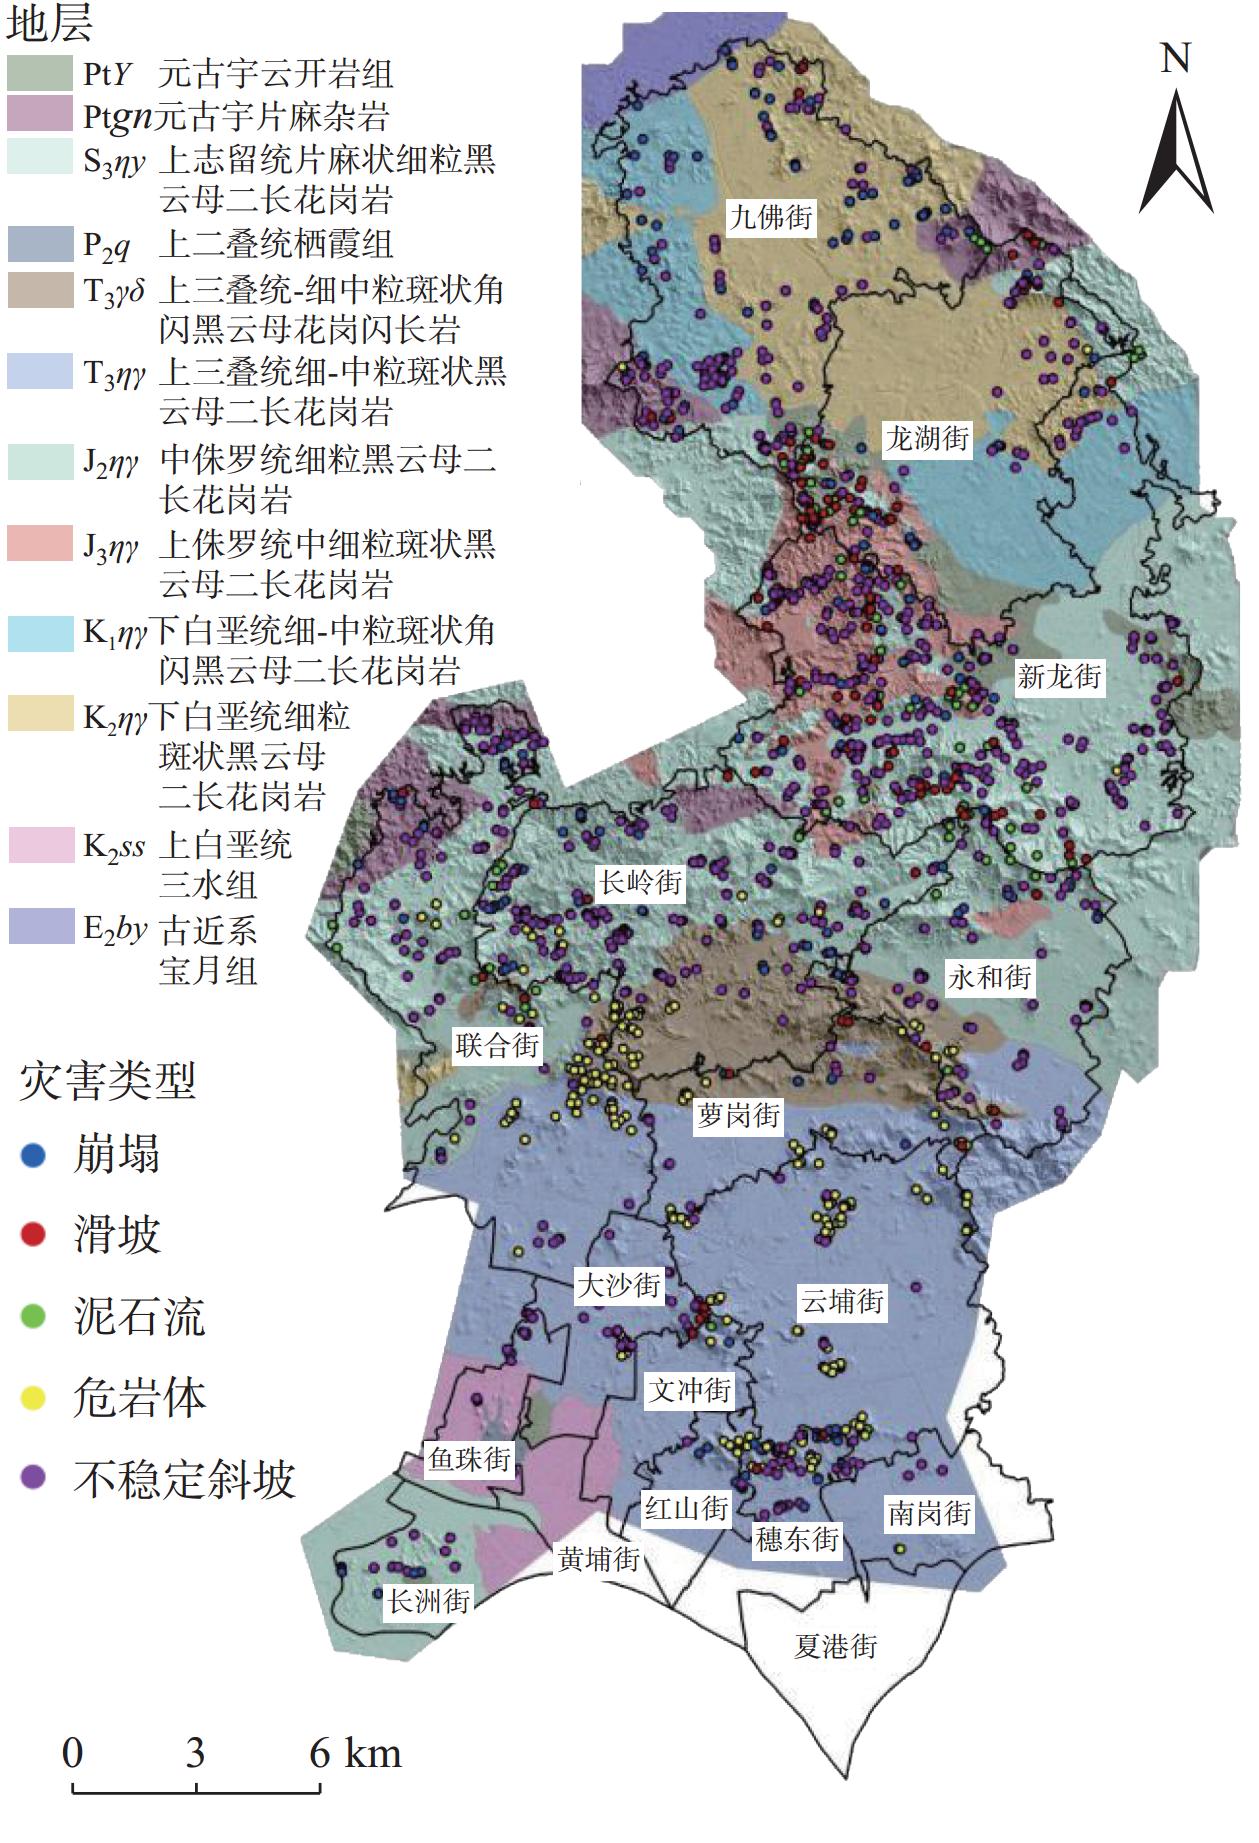
图 2 调查区机载LiDAR遥感解译成果图
Figure 2. Interpretation result map of airborne LiDAR remote sensing in the investigation area
![]()
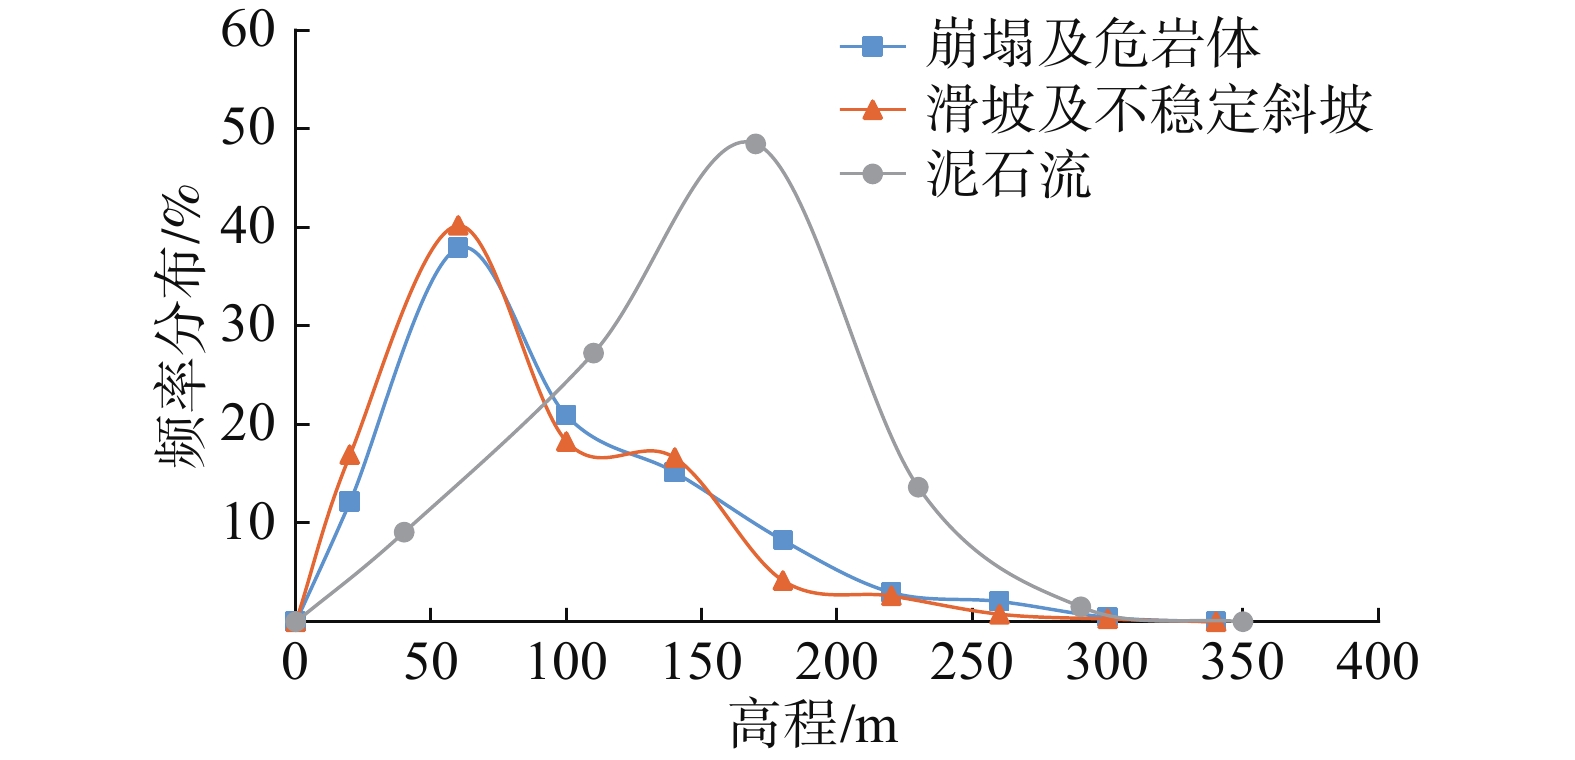
图 4 地质灾害分布特征与高程的关系
Figure 4. Relation between distribution characteristics of geological hazards and elevation
![]()
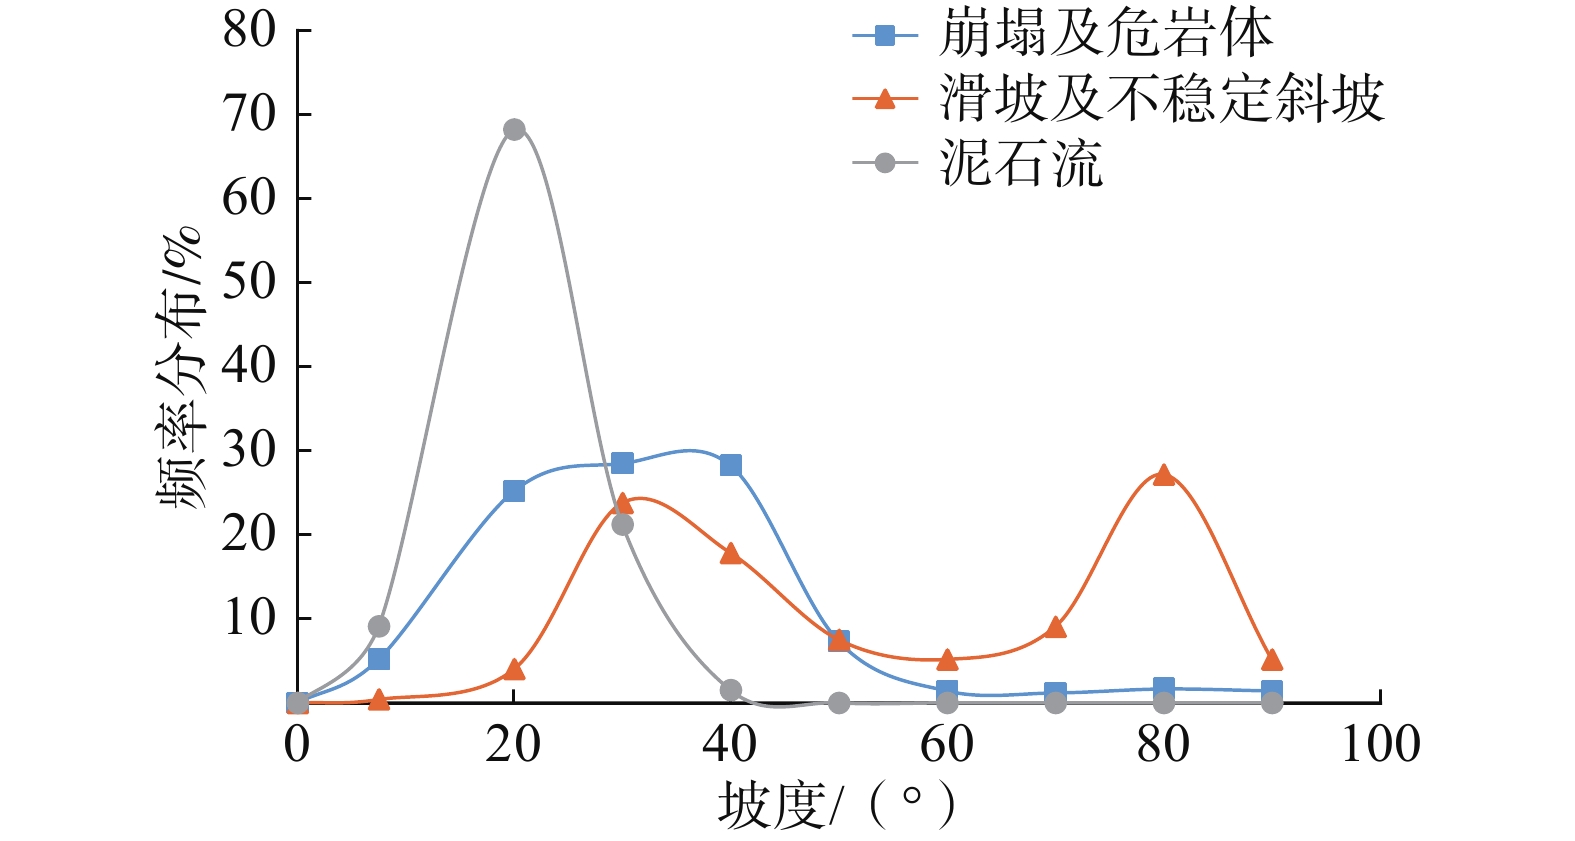
图 5 地质灾害分布特征与坡度的关系
Figure 5. Relation between distribution characteristics of geological hazards and slope gradient
![]()
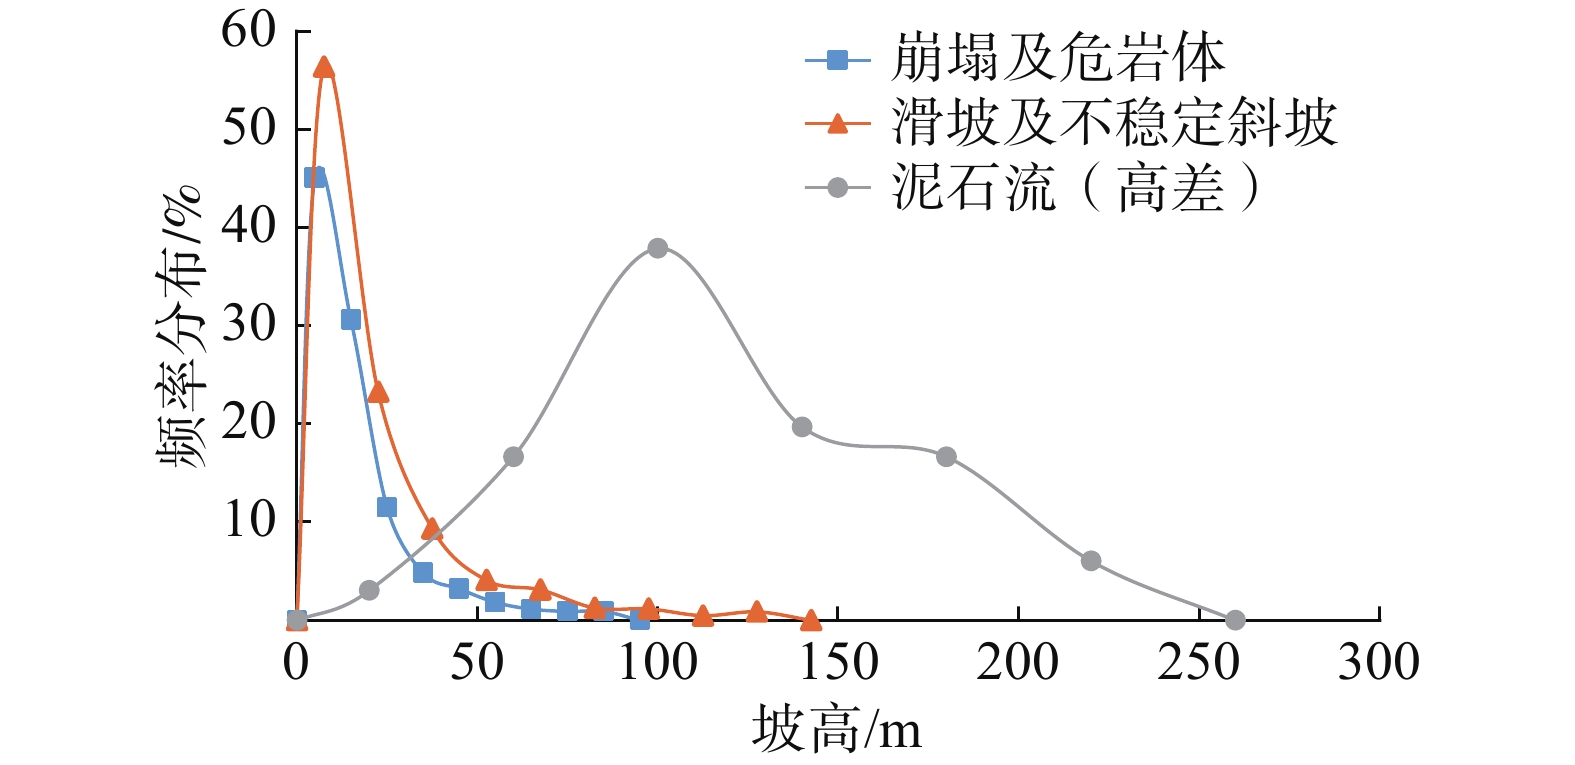
图 6 地质灾害分布特征与坡高的关系
Figure 6. Relation between distribution characteristics of geological hazards and slope height
![]()
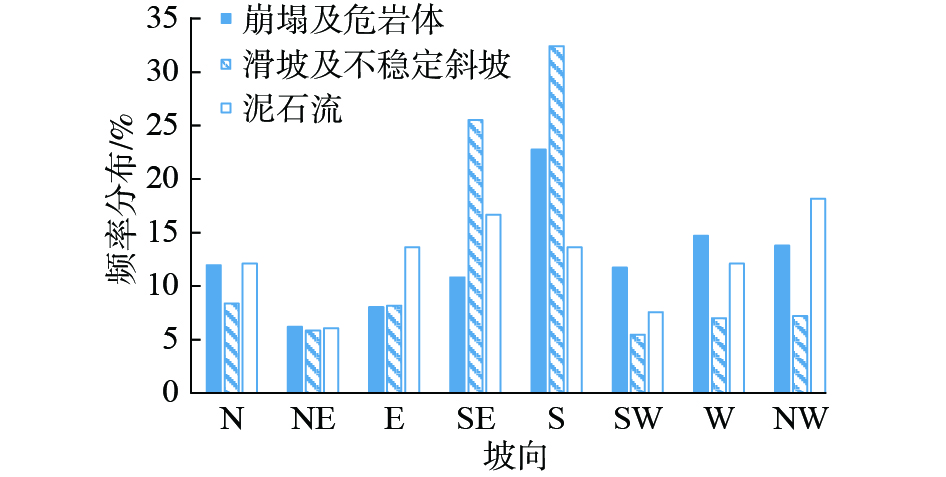
图 7 地质灾害分布特征与坡向的关系
Figure 7. Relationship between distribution characteristics of geological hazards and slope aspect
![]()
图 8 地质灾害分布特征与岩土体类型的关系
Figure 8. Relation between distribution characteristics of geological hazards and rock and soil type
![]()
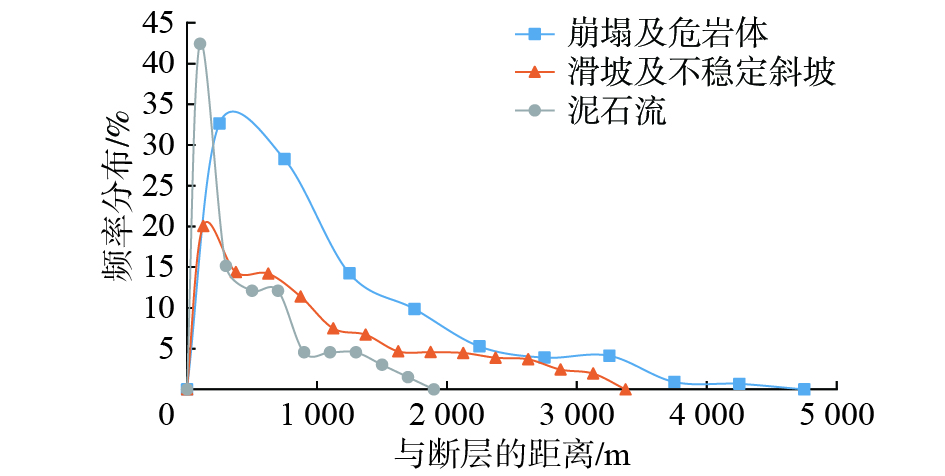
图 9 地质灾害分布特征与断层距离的关系
Figure 9. Relationship between distribution characteristics of geological hazards and distance to faults
![]()
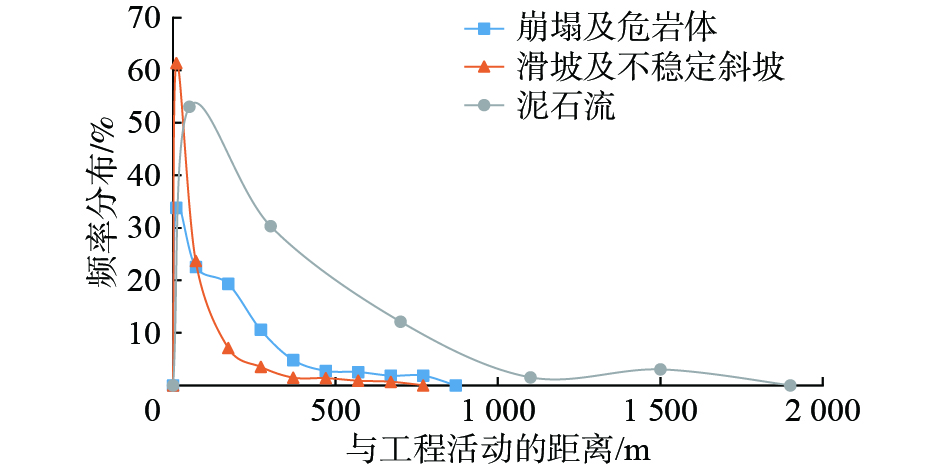
图 10 地质灾害分布特征与工程活动距离的关系
Figure 10. Relationship between distribution characteristics of geological hazards and distance from engineering activities
![]()
图 11 地质灾害分布特征与月降雨量的关系
Figure 11. Relationship between distribution characteristics of geological hazards and monthly precipitation
表 1 主要解译内容及标志
Table 1 Main interpretation contents and symbols
类型 解译标志 滑坡 滑体位置、地貌部位、范围、形态、坡度、高程、沟谷发育状况、植被发育状况、总体滑动方向、与重要建筑物的关系等 崩塌 崩塌位置、形态、分布高程;崩塌堆积体的坡度、面积、发育方向、植被类型 泥石流 流域的边界、面积、形态、主沟长度、主沟纵降比、坡度;物源区水体分布、集水面积、地形坡度、岩性、植被覆盖程度、植物类别及分布状况,崩塌、滑坡、断裂、松散堆积物等不良现象,形成泥石流固体物质的分布范围;流通区沟床的横纵坡度、冲淤变化以及泥石流痕迹,阻塞地段堆积类型、跌水、急弯、卡口情况等 危岩体 危岩体多发生在节理裂隙发育岩质山坡与峡谷陡岸上,坡度通常在55°~75°,上陡下缓,表面坎坷不平,具粗糙感,偶出现巨大块石影像;危岩体上部外围有时可见到张节理形成的裂缝影像 不稳定斜坡 不稳定斜坡位置、形态、分布高程、堆积体面积、斜坡范围内InSAR形变数据分布  下载: 导出CSV
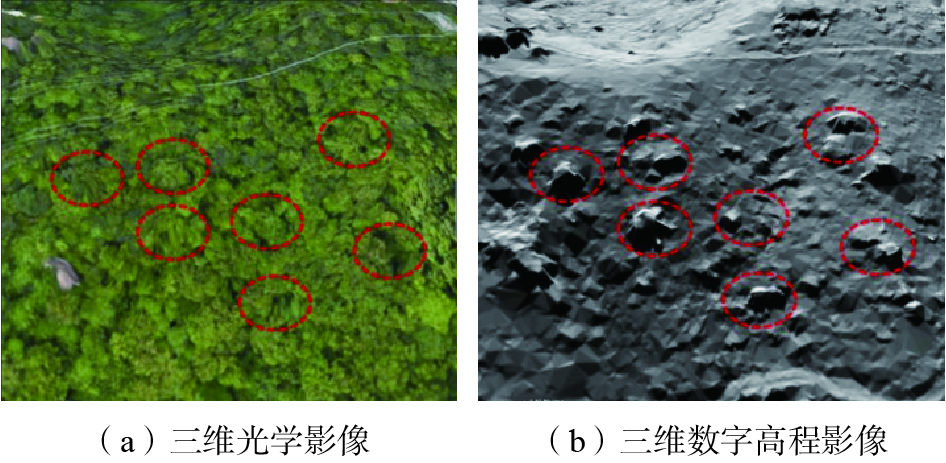
表 2 调查区内典型地质灾害解译影像及过程
Table 2 Typical geological hazards interpretation images and processes in the survey area
类别 崩塌 滑坡 泥石流 三维光学影像 


三维数字高程模型 


解译过程 崩塌多发育在陡峭山体或公路开挖边坡处,其物源区与堆积区交接处明显。在 LiDAR 数据上表现为滑源区坡度较大并可能伴随局部拉花,向堆积区过渡时则坡度突然变缓,有明显的陡缓交界线;堆积区呈现三角锥形或梨形,处于地形低处,表面粗糙度特征与环境差异较大,但新近堆积粗糙度大颗粒感明显,古老堆积则粗糙度小较光滑 对于光学影像,若坡面植被较多,通常无法进行滑坡识别;此时LiDAR 获取的数字高程模型能去除掉表面的干扰信息,很好地识别滑坡后缘的滑体缺失和前缘堆积体,滑坡后缘椅状地貌、滑坡下错迹象、滑坡表面粗糙度差异,因此滑坡边界十分清楚,关于滑坡的解译可很好体现机载LiDAR 数据区别于传统影像滑坡解译的优势 泥石流以发育地形、堆积扇和沟道范围内的不良地质体作为人工综合解译标志。泥石流沟谷为低于原有平面的负地形地貌,多为雨水汇聚通道;同时沟道内不良地质体的存在为泥石流提供可流动物源;在降雨条件下可流动物源沟道内汇聚并高速流向沟口形成堆积扇。研究区内泥石流堆积扇受人为改造程度严重,很难发现堆积扇范围边界
下载: 导出CSV
-
[1] 冯振,陈亮,王立朝,等. 区域地质灾害易发性评价的证据权法原理与实践[J]. 地质通报,2024,43(7):1255 − 1265. [FENG Zhen,CHEN Liang,WANG Lichao,et al. Principle and application of the weight-of-evidence method in regional landslide susceptibility assessment[J]. Geological Bulletin of China,2024,43(7):1255 − 1265. (in Chinese with English abstract)] FENG Zhen, CHEN Liang, WANG Lichao, et al. Principle and application of the weight-of-evidence method in regional landslide susceptibility assessment[J]. Geological Bulletin of China, 2024, 43(7): 1255 − 1265. (in Chinese with English abstract)
[2] 王明辉,曹熙平,谯立家. 危岩体精细调查与崩塌过程三维场景模拟——以西南某水电站高边坡为例[J]. 中国地质灾害与防治学报,2023,34(6):86 − 96. [WANG Minghui,CAO Xiping,QIAO Lijia. Comprehensive analysis of hazardous rock mass and simulation of potential rockfall processes using 3D terrain model:A case study of the high cut slope near damsite of a hydropower station in southern China[J]. The Chinese Journal of Geological Hazard and Control,2023,34(6):86 − 96. (in Chinese with English abstract)] WANG Minghui, CAO Xiping, QIAO Lijia. Comprehensive analysis of hazardous rock mass and simulation of potential rockfall processes using 3D terrain model: A case study of the high cut slope near damsite of a hydropower station in southern China[J]. The Chinese Journal of Geological Hazard and Control, 2023, 34(6): 86 − 96. (in Chinese with English abstract)
[3] 贾会会,薛建志,郭利召,等. “空天地” 一体化技术在采空区形变监测中的应用[J]. 中国地质灾害与防治学报,2023,34(3):69 − 82. [JIA Huihui,XUE Jianzhi,GUO Lizhao,et al. Application of combined space, arial and ground based multiple technologies in deformation monitoring of mining areas[J]. The Chinese Journal of Geological Hazard and Control,2023,34(3):69 − 82. (in Chinese with English abstract)] JIA Huihui, XUE Jianzhi, GUO Lizhao, et al. Application of combined space, arial and ground based multiple technologies in deformation monitoring of mining areas[J]. The Chinese Journal of Geological Hazard and Control, 2023, 34(3): 69 − 82. (in Chinese with English abstract)
[4] 张小红. 机载激光雷达测量技术理论与方法[M]. 武汉:武汉大学出版社,2007. [ZHANG Xiaohong. Theory and method of airborne LiDAR measurement technology[M]. Wuhan:Wuhan University Press,2007. (in Chinese)] ZHANG Xiaohong. Theory and method of airborne LiDAR measurement technology[M]. Wuhan: Wuhan University Press, 2007. (in Chinese)
[5] 薛强,张茂省,董英,等. 基于DEM和遥感的黄土地质灾害精细化风险识别——以陕北黄土高原区米脂县为例[J]. 中国地质,2023,50(3):926 − 942. [XUE Qiang,ZHANG Maosheng,DONG Ying,et al. Refinement risk identification of loess geo-hazards based on DEM and remote sensing:Taking Mizhi County in the Loess Plateau of northern Shaanxi as an example[J]. Geology in China,2023,50(3):926 − 942. (in Chinese with English abstract)] XUE Qiang, ZHANG Maosheng, DONG Ying, et al. Refinement risk identification of loess geo-hazards based on DEM and remote sensing: Taking Mizhi County in the Loess Plateau of northern Shaanxi as an example[J]. Geology in China, 2023, 50(3): 926 − 942. (in Chinese with English abstract)
[6] 韩娜娜,单新建,宋小刚. 高空间分辨率数字高程模型测量技术及其在活断层研究中的应用[J]. 地震学报,2017,39(3):436 − 450. [HAN Nana,SHAN Xinjian,SONG Xiaogang. VHR DEM measurement technology and its application in active fault research[J]. Acta Seismologica Sinica,2017,39(3):436 − 450. (in Chinese with English abstract)] HAN Nana, SHAN Xinjian, SONG Xiaogang. VHR DEM measurement technology and its application in active fault research[J]. Acta Seismologica Sinica, 2017, 39(3): 436 − 450. (in Chinese with English abstract)
[7] 孙鑫喆,唐声权. 光学遥感技术的发展及其在活动构造研究中的应用[J]. 地震地质,2016,38(1):211 − 220. [SUN Xinzhe,TANG Shengquan. The development of optical remote sensing technology and its application to the active tectonics research[J]. Seismology and Geology,2016,38(1):211 − 220. (in Chinese with English abstract)] SUN Xinzhe, TANG Shengquan. The development of optical remote sensing technology and its application to the active tectonics research[J]. Seismology and Geology, 2016, 38(1): 211 − 220. (in Chinese with English abstract)
[8] 许强,董秀军,李为乐. 基于天-空-地一体化的重大地质灾害隐患早期识别与监测预警[J]. 武汉大学学报(信息科学版),2019,44(7):957 − 966. [XU Qiang,DONG Xiujun,LI Weile. Integrated space-air-ground early detection,monitoring and warning system for potential catastrophic geohazards[J]. Geomatics and Information Science of Wuhan University,2019,44(7):957 − 966. (in Chinese with English abstract)] XU Qiang, DONG Xiujun, LI Weile. Integrated space-air-ground early detection, monitoring and warning system for potential catastrophic geohazards[J]. Geomatics and Information Science of Wuhan University, 2019, 44(7): 957 − 966. (in Chinese with English abstract)
[9] 陈松,陈长敬,罗士新,等. 广州南沙厚覆盖区近地表地层结构分析: 基于二维地球物理多方法探测结果[J]. 地质通报,2023,42(1):168 − 179. [CHEN Song,CHEN Changjing,LUO Shixin,et al. Near surface stratigraphic structure analysis in Nansha of Guangzhou thick overburden area: based on multi method results of 2D geophysics exploration[J]. Geological Bulletin of China,2023,42(1):168 − 179. (in Chinese with English abstract)] CHEN Song, CHEN Changjing, LUO Shixin, et al. Near surface stratigraphic structure analysis in Nansha of Guangzhou thick overburden area: based on multi method results of 2D geophysics exploration[J]. Geological Bulletin of China, 2023, 42(1): 168 − 179. (in Chinese with English abstract)
[10] 邵延秀,张波,邹小波,等. 采用无人机载LiDAR进行快速地质调查实践[J]. 地震地质,2017,39(6):1185 − 1197. [SHAO Yanxiu,ZHANG Bo,ZOU Xiaobo,et al. Application of uavls to rapid geological surveys[J]. Seismology and Geology,2017,39(6):1185 − 1197. (in Chinese with English abstract)] SHAO Yanxiu, ZHANG Bo, ZOU Xiaobo, et al. Application of uavls to rapid geological surveys[J]. Seismology and Geology, 2017, 39(6): 1185 − 1197. (in Chinese with English abstract)
[11] 刘圣伟,郭大海,陈伟涛,等. 机载激光雷达技术在长江三峡工程库区滑坡灾害调查和监测中的应用研究[J]. 中国地质,2012,39(2):507 − 517. [LIU Shengwei,GUO Dahai,CHEN Weitao,et al. The application of airborne LiDAR technology in landslide investigation and monitoring of Three Gorges Reservoir Area[J]. Geology in China,2012,39(2):507 − 517. (in Chinese with English abstract)] LIU Shengwei, GUO Dahai, CHEN Weitao, et al. The application of airborne LiDAR technology in landslide investigation and monitoring of Three Gorges Reservoir Area[J]. Geology in China, 2012, 39(2): 507 − 517. (in Chinese with English abstract)
[12] 康帅,张景发,崔效峰,等. 基于高精度地基LiDAR技术的活动断层错断地貌研究——以冷龙岭活动断裂带为例[J]. 地震,2017,37(3):61 − 71. [KANG Shuai,ZHANG Jingfa,CUI Xiaofeng,et al. Offset landform caused by active fault based on high precision terrestrial LiDAR data:A case study of the Lenglongling active fault zone[J]. Earthquake,2017,37(3):61 − 71. (in Chinese with English abstract)] KANG Shuai, ZHANG Jingfa, CUI Xiaofeng, et al. Offset landform caused by active fault based on high precision terrestrial LiDAR data: A case study of the Lenglongling active fault zone[J]. Earthquake, 2017, 37(3): 61 − 71. (in Chinese with English abstract)
[13] 陈涛,张培震,刘静,等. 机载激光雷达技术与海原断裂带的精细地貌定量化研究[J]. 科学通报,2014,59(14):1293 − 1304. [CHEN Tao,ZHANG Peizhen,LIU Jing,et al. Quantitative study of tectonic geomorphology along Haiyuan fault based on airborne LiDAR[J]. Chinese Science Bulletin,2014,59(14):1293 − 1304. (in Chinese with English abstract)] CHEN Tao, ZHANG Peizhen, LIU Jing, et al. Quantitative study of tectonic geomorphology along Haiyuan fault based on airborne LiDAR[J]. Chinese Science Bulletin, 2014, 59(14): 1293 − 1304. (in Chinese with English abstract)
[14] 李显巨. 基于新型遥感数据的典型地质环境信息智能识别[D]. 武汉:中国地质大学,2016. [LI Xianju. Intelligent identification of typical geo-environmental information using new remote sensing data[D]. Wuhan:China University of Geosciences,2016. (in Chinese with English abstract)] LI Xianju. Intelligent identification of typical geo-environmental information using new remote sensing data[D]. Wuhan: China University of Geosciences, 2016. (in Chinese with English abstract)
[15] 佘金星,程多祥,刘飞,等. 机载激光雷达技术在地质灾害调查中的应用——以四川九寨沟7.0级地震为例[J]. 中国地震,2018,34(3):435 − 444. [SHE Jinxing,CHENG Duoxiang,LIU Fei,et al. Application of airborne LiDAR technology in geological disaster investigation:Taking the Jiuzhaigou Ms7.0 earthquake in Sichuan Province as an example[J]. Earthquake Research in China,2018,34(3):435 − 444. (in Chinese with English abstract)] SHE Jinxing, CHENG Duoxiang, LIU Fei, et al. Application of airborne LiDAR technology in geological disaster investigation: Taking the Jiuzhaigou Ms7.0 earthquake in Sichuan Province as an example[J]. Earthquake Research in China, 2018, 34(3): 435 − 444. (in Chinese with English abstract)
[16] 董秀军,许强,佘金星,等. 九寨沟核心景区多源遥感数据地质灾害解译初探[J]. 武汉大学学报(信息科学版),2020,45(3):432 − 441. [DONG Xiujun,XU Qiang,SHE Jinxing,et al. Preliminary study on interpretation of geological hazards in Jiuzhaigou based on multi-source remote sensing data[J]. Geomatics and Information Science of Wuhan University,2020,45(3):432 − 441. (in Chinese with English abstract)] DONG Xiujun, XU Qiang, SHE Jinxing, et al. Preliminary study on interpretation of geological hazards in Jiuzhaigou based on multi-source remote sensing data[J]. Geomatics and Information Science of Wuhan University, 2020, 45(3): 432 − 441. (in Chinese with English abstract)
[17] 罗达,林杭生,金钊,等. 无人机数字摄影测量与激光雷达在地形地貌与地表覆盖研究中的应用及比较[J]. 地球环境学报,2019,10(3):213 − 226. [LUO Da,LIN Hangsheng,JIN Zhao,et al. Applications of UAV digital aerial photogrammetry and LiDAR in geomorphology and land cover research[J]. Journal of Earth Environment,2019,10(3):213 − 226. (in Chinese with English abstract)] LUO Da, LIN Hangsheng, JIN Zhao, et al. Applications of UAV digital aerial photogrammetry and LiDAR in geomorphology and land cover research[J]. Journal of Earth Environment, 2019, 10(3): 213 − 226. (in Chinese with English abstract)
[18] 曲雪妍,李媛,房浩,等. 基于时空维度耦合的地质灾害发育程度评价研究[J]. 水文地质工程地质,2022,49(1):137 − 145. [QU Xueyan,LI Yuan,FANG Hao,et al. A study of the evaluation of geo-hazards development degree based on time-space coupling[J]. Hydrogeology & Engineering Geology,2022,49(1):137 − 145. (in Chinese with English abstract)] QU Xueyan, LI Yuan, FANG Hao, et al. A study of the evaluation of geo-hazards development degree based on time-space coupling[J]. Hydrogeology & Engineering Geology, 2022, 49(1): 137 − 145. (in Chinese with English abstract)
[19] 郑史芳,黎治坤. 结合倾斜摄影技术的地质灾害监测[J]. 测绘通报,2018(8):88 − 92. [ZHENG Shifang,LI Zhikun. Geohazard monitoring based on tilt photography[J]. Bulletin of Surveying and Mapping,2018(8):88 − 92. (in Chinese with English abstract)] ZHENG Shifang, LI Zhikun. Geohazard monitoring based on tilt photography[J]. Bulletin of Surveying and Mapping, 2018(8): 88 − 92. (in Chinese with English abstract)
[20] 葛大庆,戴可人,郭兆成,等. 重大地质灾害隐患早期识别中综合遥感应用的思考与建议[J]. 武汉大学学报(信息科学版),2019,44(7):949 − 956. [GE Daqing,DAI Keren,GUO Zhaocheng,et al. Early identification of serious geological hazards with integrated remote sensing technologies:thoughts and recommendations[J]. Geomatics and Information Science of Wuhan University,2019,44(7):949 − 956. (in Chinese with English abstract)] GE Daqing, DAI Keren, GUO Zhaocheng, et al. Early identification of serious geological hazards with integrated remote sensing technologies: thoughts and recommendations[J]. Geomatics and Information Science of Wuhan University, 2019, 44(7): 949 − 956. (in Chinese with English abstract)
[21] 杨航,辛宇佳,李建华,等. 广东莲花山花岗岩体锆石U-Pb年龄、地球化学特征及地质意义[J]. 地球学报,2022,43(2):211 − 223. [YANG Hang,XIN Yujia,LI Jianhua,et al. Zircon U-Pb ages and geochemical constraints of the Lianhuashan granitoids in Guangdong Province and their geological implications[J]. Acta Geoscientica Sinica,2022,43(2):211 − 223. (in Chinese with English abstract)] YANG Hang, XIN Yujia, LI Jianhua, et al. Zircon U-Pb ages and geochemical constraints of the Lianhuashan granitoids in Guangdong Province and their geological implications[J]. Acta Geoscientica Sinica, 2022, 43(2): 211 − 223. (in Chinese with English abstract)
-
期刊类型引用(23)
1. 马明明,伍尚前,谢猛,童鹏,袁晓波. 决策树分类在铁路沿线桉树提取及滑坡隐患识别中的应用——以贵广高铁广西段为例. 中国地质灾害与防治学报. 2025(01): 37-45 .  本站查看
本站查看
2. 刘亚静,刘红健. 基于信息量-随机森林模型的地震带地质灾害易发性评价:以松潘-较场地震带为例. 科学技术与工程. 2024(01): 143-154 . 百度学术
3. 黄海,江思义,李海良,李春玲,吴秋菊. 岩溶地区危岩和岩质崩塌易发性评价研究——以广西贺州市平桂区为例. 成都理工大学学报(自然科学版). 2024(01): 137-151 . 百度学术
4. 刘玥,申玉松,李旭,张迪. 基于不同耦合模型的区域地质灾害易发性评价——以河南商城县为例. 中国地质调查. 2024(01): 83-92 . 百度学术
5. 高茂宁,魏冠军,雷传金,张沛. 顾及时序InSAR的海东市辖区滑坡敏感性评价. 地理空间信息. 2024(05): 97-101 . 百度学术
6. 石文君,王宇栋,解晋航,李章杰,梁形形. 基于多种模型对比的寻甸县地质灾害易发性分析. 矿产勘查. 2024(06): 1092-1102 . 百度学术
7. 寸得欣,令狐昌卫,马一奇,尹林虎,陈庆松,刘振南,涂春霖. 基于GIS和加权信息量模型的富源县地质灾害易发性评价. 科学技术与工程. 2024(18): 7563-7573 . 百度学术
8. 冯振,陈亮,王立朝,侯圣山,田怡帆,刘明学. 区域地质灾害易发性评价的证据权法原理与实践. 地质通报. 2024(07): 1255-1265 . 百度学术
9. 张宇,简季,郝利娜,杨鑫. 基于IV-MLP耦合模型的龙陵县滑坡易发性评价. 物探化探计算技术. 2024(05): 618-626 . 百度学术
10. 桂富羽,史正涛,喜文飞,付尧,郭峻杞. 基于证据权模型的滑坡灾害易发性评价研究——以普洱市为例. 城市勘测. 2024(05): 188-193+198 . 百度学术
11. 梁峰,江攀和. 基于IVM-CF耦合模型的贵定县滑坡地质灾害易发性评价. 水利水电技术(中英文). 2024(S2): 669-677 . 百度学术
12. 裴鹏程,黄帅,袁静,张智康. 走滑断层作用下上覆土层的变形破坏机理. 中国地质灾害与防治学报. 2024(06): 115-127 . 本站查看
13. 赖波,赵风顺,江金进,江山,江宁,李俊生. 基于AHP-信息量法的珠海市地质灾害风险评价. 华南地质. 2023(01): 147-156 . 百度学术
14. 阮征,周少伟,姚胜,田垚. 黄土高原腹地地质灾害致灾因素分析及易发性评价. 科技导报. 2023(10): 115-124 . 百度学术
15. 王伟中,李树兴,杨成,许涛,宋飞,曹小红,李浩然,王伟华. 基于GIS和证据权模型的山阳县地质灾害易发性评价. 新疆地质. 2023(02): 262-269 . 百度学术
16. 黄鑫,吴珍云,丁德建,李希星,石祖峰,祝民强,孙彬涵. 基于信息量-逻辑回归模型的江西省婺源县地质灾害易发性评价. 东华理工大学学报(自然科学版). 2023(03): 259-268 . 百度学术
17. 曾斌,吕权儒,寇磊,艾东,许汇源,袁晶晶. 基于Logistic回归和随机森林的清江流域长阳库岸段堆积层滑坡易发性评价. 中国地质灾害与防治学报. 2023(04): 105-113 . 本站查看
18. 胡杨,张紫昭,林世河. 基于证据权与逻辑回归耦合的新疆伊犁河谷地区滑坡易发性评价. 工程地质学报. 2023(04): 1350-1363 . 百度学术
19. 张潇远,苏巧梅,赵财胜,朱月琴,李凯新,范锦龙,白东升. 一种利用贝叶斯算法优化XGBoost的滑坡易发性评价方法. 测绘科学. 2023(06): 140-150 . 百度学术
20. 张华湘,孙乾征,樊善兴,杨子林. 滑坡易发性评价方法和精度比较——以贵州省大方县为例. 贵州地质. 2023(03): 302-309+295 . 百度学术
21. 龚芯磊,张斌,高金利,杨洪森. 基于斜坡单元尺度AHP-信息量模型的重点区域地质灾害风险评价——以贵州省紫云县中部重点区为例. 贵州地质. 2023(03): 310-320 . 百度学术
22. 谭燕,崔雨,金华丽,方龙建,葛鹏,付乐意. 基于信息量模型及层次分析法的镇江丹徒区滑坡崩塌地质灾害易发性评价. 昆明冶金高等专科学校学报. 2023(04): 7-15 . 百度学术
23. 董凯,王永卿,蒲秀勇,梁凯丽. 基于信息量法的广西南宁市武鸣区地质灾害易发性评价. 农业灾害研究. 2023(09): 300-303 . 百度学术
其他类型引用(8)


计量
- 文章访问数: 105
- HTML全文浏览量: 24
- PDF下载量: 62
- 被引次数: 31
 邮件订阅
邮件订阅 RSS
RSS