

Risk assessment of single gully debris flows based on dynamic changes of provenance in the Wenchuan earthquake zone: A case study of Qipan gully
-
摘要:
“5•12”汶川特大地震后,震区山体表面产生大量碎屑物,植被遭到严重破坏,为泥石流暴发提供了极为丰富的物质来源,大大增加了泥石流的危险性。多年来,研究人员针对震后泥石流危险性的评估主要考虑植被恢复情况,较少考虑泥石流沟道存在大量的动储量物质对危险性评估的重要影响。为此,基于现场勘察资料,以汶川县七盘沟为研究对象,采用多源多尺度监测手段(Landsat系列、Quick-bird与无人机)对震前震后坡面物源与沟道物源进行分析统计,综合利用博弈论组合赋权结合云模型构建泥石流危险性动态评价模型,对2005—2019年泥石流暴发的危险性进行评价。结果表明:震后坡面物源是震前的7.7倍,到2019年坡面物源已基本恢复至震前水平。经相关资料记载震后泥石流暴发冲出量及清淤工程量进行统计估算可知,到2019年泥石流动态物源减少约7.813×10⁶ m3。相对比只考虑坡面物源,分别考虑坡面和沟道物源对危险性评价所取得的结果,更切合现实。所得结果对在日益增加的高烈度山区开展重要工程所遭受的单沟泥石流危险性动态评价提供参考与借鉴作用,有效保护人民的生命和财产安全。
Abstract:Following the catastrophic “5•12” Wenchuan earthquake, extensive debris was deposited on mountain surfaces in the earthquake zone, and significant vegetation damage occurred, providing abundant material for debris flow outbreaks and substantially increasing their risk. Previous studies primarily focused on vegetation recovery when assessing post-earthquake debris flow risks. However, field surveys revealed that large quantities of dynamic storage materials in the gullies significantly impact risk assessments. Based on field survey data, this study uses Qipan gully in Wenchuan County as a research subject and employs multi-source and multi-scale monitoring tools (Landsat series, Quick-bird, and UAVs) to analyze and statistically assess the source materials on slopes and gullies both pre- and post-earthquake. A dynamic risk assessment model for debris flow is constructed using game theory combined with a cloud model, assessing the risk from 2005 to 2019. Findings indicate that post-earthquake slope material sources were 7.7 times those pre-earthquake, and by 2019, with recovery to pre-earthquake levels by 2019. Statistical estimations based on recorded debris flow eruptions and sediment removal volumes show a reduction of approximately 7.813×10⁶ m3 in dynamic material sources by 2019. Assessing both slope and gully material sources yields more realistic results than considering slope sources alone. These results provide references and guidance for dynamic risk assessments of debris flow, impacting major engineering projects in increasingly seismic regions and effectively ensuring the safety of life and property.
-
Keywords:
- Wenchuan earthquake /
- debris flow /
- provenance changes /
- combined weighting method /
- cloud model /
- risk assessment
-
0. 引 言
随着我国经济发展战略向西部倾斜,西部地区交通基础建设工程数量正逐年递增,工程建设虽然给西部地区提供了新的发展机遇,但也因此产生了大量的土质路堑边坡,在降雨作用下路堑边坡频发滑塌灾害,严重影响公路的生态建设及安全运营。
降雨条件下,路堑边坡塌滑灾害已成为制约山区公路建设的重要问题之一。目前,相关学者[1]认为一般情况下降雨诱发的为浅层斜坡破坏;李同录等[2]认为边坡浅层滑移是降雨坡面直接入渗引起,且浅层滑移的厚度相当于湿润锋的深度,一般不超过2 m;石诚鋆等[3]通过数值模拟分析了降雨条件下坡比、坡高、雨强、降雨历时以及土体渗透系数等因素对边坡稳定性的影响;蔡荣坤等[4]依托实际工程案例,重点分析降雨强度、降雨历时及边坡坡率对边坡潜在滑动模式的影响;孙萍萍等[5]基于Hydrus中的Slope Cube模块,通过数值模拟手段分析了不同坡型的黄土边坡在降雨条件下的浅层破坏过程以及破坏机制;胡华等[6]通过模拟室内降雨滑坡试验,比较了不同坡度和降雨强度条件下的斜坡滑塌破坏机理;杜忠原等[7]和李宁等[8]分别通过数值模拟研究了降雨条件下锚杆和抗滑桩支护作用对边坡稳定性的影响,并分析了不同支护条件下边坡浅层的破坏形态。但关于降雨条件下路堑边坡浅层塌滑机制及其影响因素的主次关系研究不够深入。
本文依托甘肃省双达高速公路K28段路堑边坡,首先通过FLAC3D有限元软件平台的二次开发技术编写FISH语言,实现饱和度、重度和土体抗剪强度之间的动态关联,然后基于强度折减法分析不同变量下(降雨强度、降雨历时和坡比)路堑边坡的安全系数和破坏形式,并根据灰色关联理论分析各变量对边坡稳定性影响程度的主次关系,最后分别通过室内降雨试验和现场生态防护试验总结出路堑边坡浅层塌滑机制,提出浅层塌滑的生态防治措施,研究成果对降雨条件下路堑边坡浅层塌滑灾害防治具有参考价值。
1. 灰色关联度理论
灰色关联分析法是通过比较自变量和因变量数据序列曲线的几何形状相似度,并据此判断两者之间的关联性[9],其具体步骤如下:
(1)原始数据无量纲和归一化
将边坡安全系数的影响因素作为自变量参考矩阵X,将边坡的安全系数作为因变量参考矩阵Y,矩阵 X和矩阵 Y相似,其中矩阵X为:
$$ {{{\boldsymbol{X}}}} = \left[ {\begin{array}{*{20}{c}} {{{{X}}_1}} \\ {{{{X}}_2}} \\ \vdots \\ {{{{X}}_m}} \end{array}} \right] = {\left[ {\begin{array}{*{20}{c}} {{{{x}}_{11}}}&{{{{x}}_{12}}}& \cdots &{{{{x}}_{1n}}} \\ {{x_{21}}}&{{x_{22}}}& \cdots &{{{{x}}_{2n}}} \\ \vdots & \vdots & \ddots & \vdots \\ {{{{x}}_{m1}}}&{{{{x}}_{m2}}}& \cdots &{{{{x}}_{mn}}} \end{array}} \right]^{{{m}} \times {{n}}}} $$ (1) 通过无量纲和归一化参考矩阵X可得:
$$ {{{\boldsymbol{X}}'}} = \left[ {\begin{array}{*{20}{c}} {{X'_1}} \\ {{X'_2}} \\ \vdots \\ {{X'_m}} \end{array}} \right] = {\left[ {\begin{array}{*{20}{c}} {\frac{{{{n}}{{{x}}_{11}}}}{{\displaystyle\sum\limits_{{{j}} = 1}^{{n}} {{{{x}}_{1j}}} }}}&{\frac{{{{n}}{{{x}}_{12}}}}{{\displaystyle\sum\limits_{{{j}} = 1}^{{n}} {{{{x}}_{1j}}} }}}& \cdots &{\frac{{{{n}}{{{x}}_{1n}}}}{{\displaystyle\sum\limits_{{{j}} = 1}^{{n}} {{{{x}}_{1j}}} }}} \\ {\frac{{{{n}}{{{x}}_{21}}}}{{\displaystyle\sum\limits_{{{j}} = 1}^{{n}} {{{{x}}_{2j}}} }}}&{\frac{{{{n}}{{{x}}_{22}}}}{{\displaystyle\sum\limits_{{{j}} = 1}^{{n}} {{{{x}}_{2j}}} }}}& \cdots &{\frac{{{{n}}{{{x}}_{2n}}}}{{\displaystyle\sum\limits_{{{j}} = 1}^{{n}} {{{{x}}_{2j}}} }}} \\ \vdots & \vdots & \ddots & \vdots \\ {\frac{{{{n}}{{{x}}_{m1}}}}{{\displaystyle\sum\limits_{{{j}} = 1}^{{n}} {{{{x}}_{mj}}} }}}&{\frac{{{{n}}{{{x}}_{m2}}}}{{\displaystyle\sum\limits_{{{j}} = 1}^{{n}} {{{{x}}_{mj}}} }}}& \cdots &{\frac{{{{n}}{{{x}}_{mn}}}}{{\displaystyle\sum\limits_{{{j}} = 1}^{{n}} {{{{x}}_{mj}}} }}} \end{array}} \right]^{{{m}} \times {{n}}}} $$ (2) 同理,可计算出无量纲和归一化后因变量参考矩阵
$ {{{\boldsymbol{Y}}'}} $ 。(2)关联系数计算
对归一化后的自变量参考矩阵
${{\boldsymbol{X}}'_{{{mn}}}}$ 和因变量参考矩阵${{\boldsymbol{Y}}'_{{{mn}}}}$ 进行差异性分析,其差异性矩阵为:$$ {\Delta }_{{mn}}={\left[\left|X '_{1}-Y '_{1}\right|{,}\left|X '_{2}-Y '_{2}\right|{,}\cdots {,}\left|X '_{{m}}-Y '_{{m}}\right|\right]}^{{{T}}} $$ (3) 由式(3)可得到差异性矩阵元素的最大值和最小值分别为:
$$ {{M}} = {\text{max}}({\Delta _{{{mn}}}}) $$ (4) $$ {{m}} = {\text{min}}({\Delta _{{{mn}}}}) $$ (5) 自变量和因变量对应元素间的关联系数为:
$$ \xi ({\Delta _{{{mn}}}}) = \frac{{{{m}} + \rho \cdot {{M}}}}{{{\Delta _{{{mn}}}} + \rho \cdot {{M}}}} $$ (6) 式中:ξ(∆mn) ——关联系数矩阵,这里ξ(∆mn)其实是差 异序列矩阵∆mn的灰色关联系数矩阵;
M、m——差异序列矩阵元素的最大值和最小值;
ρ——分辨系数,
$ \rho \in [0,1] $ ,一般取0.5。(3)灰色关联度计算
根据式(6)将各因素的关联系数均值作为该因素评价指标的关联度ri:
$$ {{{r}}_{{m}}} = \frac{1}{{{n}}}\sum\limits_{{\rm{j}} = 1}^{\rm{n}} \xi ({\Delta _{{{mn}}}})$$ (7) 式中:n——计算对象数量。
根据式(7)可求出各因素关联度,按照从大到小的顺序进行排列,ri值越大,自变量和因变量间的关联度越高,即自变量对因变量的影响最大。
2. 有限元计算案例
2.1 工程背景
双达高速某路堑边坡位于甘肃省临夏县、夏河县与青海省循化县交界处K28+655—K28+800段,坡体高度为6.72 m,坡度为1∶1,采用拱形骨架植草护坡,坡体上部为碎石土,以粉质黏土为主,颜色呈灰褐色,密实程度为稍密或中密,室内测得天然含水率平均值为23.52%,其中碎石含量约为20%,粒径为20~60 mm,层厚3.6 m;中部为全风化闪长岩,构造基本风化破坏,岩芯破碎,多呈泥柱状,含少量碎块状,层厚5.5 m;下部为强风化闪长岩,块状构造,矿物成分以辉石、角闪石等为主,节理裂隙较发育,岩芯破碎,多呈碎块状,少量短柱状,层厚10.3 m,其现场全貌见图1。
![]() 图 1 双达高速公路某粉质黏土路堑边坡滑塌现象Figure 1. Site photo of collapsed slope in a silty clay cutting slope along the Shuangcheng to Dalijia expressway
图 1 双达高速公路某粉质黏土路堑边坡滑塌现象Figure 1. Site photo of collapsed slope in a silty clay cutting slope along the Shuangcheng to Dalijia expressway2.2 计算模型参数
根据现场情况设置坡体高度为6.72 m,坡比为1∶1,降雨强度为5 mm/h,降雨历时为48 h,地表基质吸力为50 kPa,基质吸力沿深度呈线性分布。降雨过程中,若降雨强度小于或等于坡体最外侧土体入渗率时,入渗率取降雨强度,反之则取土体最大渗透系数。模型侧面及底面固定,侧面设置为不透水边界,模型底部设置为透水边界,选用各向同性渗流模型,土体本构为Mohr-Coulomb模型。设置M1、M2和M3剖面分别监测坡脚、坡中和坡肩部位的孔隙水压力变化,模型尺寸及网格划分如图2所示,相关参数见表1。
表 1 土体材料参数Table 1. Basic physical parameters of undisturbed soil弹性模量
/MPa泊松比 密度
/(g·cm−3)渗透系数
/(cm·s−1)有效黏聚力
/kPa有效内摩擦
角/(°)12.00 0.3 1.88 4.5×10⁻⁵ 26.7 28.5 2.3 土-水特征曲线
通过压力膜仪获取不同含水率对应的基质吸力(图3试验数据),然后结合Van-Genuchten数学模型[10]得到体积含水率和基质吸力之间的关系,拟合出相应的土水特征曲线(图3拟合曲线),并计算出相应的VG模型参数(表2),其中θs为饱和体积含水率, θr为残余体积含水率,α、n为拟合参数 ,R2为拟合度。
表 2 VG模型参数Table 2. Summary table of VG model parameters参数 θs θr α n R2 取值 0.4592 0.0837 0.0720 1.2661 0.9655 2.4 非饱和土体抗剪强度参数
现采用剪切速率为0.8 mm/min的电动四联式等应变控制直剪仪(南京土壤仪器有限公司生产)进行不同含水率试样的直剪试验,取土深度约为1.5m,其土体抗剪强度参数随含水率的变化关系如图4所示。
![]() 图 4 不同含水率下土体抗剪强度参数Figure 4. Shear strength parameter of soil at different water content
图 4 不同含水率下土体抗剪强度参数Figure 4. Shear strength parameter of soil at different water content由图4可知土体黏聚力在含水率15%~18%范围内发生突变,因此可采用分段式函数拟合黏聚力和含水率的关系。室内试验测得土体比重Gs=2.71,孔隙比e=0.82,根据饱和度Sr和含水率w之间的关系可得:
$$ \left\{ \begin{gathered} {{{c}}_{{1}}}{{ = }} - 10.7{{{S}} _{{{\rm{r}}}}}{{ + }}26.703,\;\;{{{S}} _{{{\rm{r}}}}} < 45.70\% \\ {{{c}}_{{2}}}{{ = }} - 42.5{{{S}} _{{{\rm{r}}}}}{{ + }}44.236,\;\;{{{S}} _{{{\rm{r}}}}} \geqslant 45.70\% \\ \end{gathered} \right. $$ (8) $$ \varphi {\text{ = }} - 5.6{{{S}}_{\text{r}}}{\text{ + }}28.541 $$ (9) 式中:Sr——饱和度/%;
c1、c2——不同饱和度(含水率)条件下试样的总黏 聚力/kPa,c1为饱和度小于45.70%时试 样的总黏聚力,c2为饱和度大于或等于 45.70%时试样的总黏聚力;
φ——总内摩擦角/(°)。
Fredlund等[11]在1978年建立了非饱和土的双变量抗剪强度公式,其表达式为:
$$ {\tau _{{{\rm{f}}}}} = {{c'}} + \left( {\sigma - {{{u}}_{{{\rm{a}}}}}} \right)\tan \varphi ' + \left( {{{{u}}_{{{\rm{a}}}}} - {{{u}}_{{{\rm{w}}}}}} \right)\tan {\varphi ^{{{\rm{b}}}}} $$ (10) 式中:τf——非饱和土抗剪强度/kPa;
$ {{c'}} $ 、$ \varphi ' $ ——土体有效抗剪强度参数,单位分别为kPa 和°;$\sigma - {{{u}}_{\rm{a}}}$ ——净法向应力/kPa;${{{u}}_{\rm{a}}}$ ——孔隙气压力/kPa;${{{u}}_{\rm{w}}}$ ——孔隙水压力/kPa;${{{u}}_{\rm{a}}} - {{{u}}_{\rm{w}}}$ ——基质吸力/kPa;φb——受基质吸力影响的内摩擦角/(°)。
为将有效黏聚力和吸附强度叠加起来,可采用总黏聚力表示基质吸力影响下土体抗剪强度变化[12],其表达式为:
$$ {{c}} = {{c'}} + \left( {{{{u}}_{\rm{a}}} - {{{u}}_{\rm{w}}}} \right)\tan {\varphi ^{{{\rm{b}}}}} $$ (11) 式中:c——总黏聚力/kPa。
将式(11)代入式(10)可得修正后的Fredlund非饱和土抗剪强度公式为:
$$ {\tau _{{{\rm{f}}}}} = {{c}} + \left( {\sigma - {{{u}}_{\rm{a}}}} \right)\tan \varphi $$ (12) 将式(8)—(9)代入式(12)可建立以饱和度为变量的分段式抗剪强度公式和湿重度公式:
$$ \left\{ \begin{gathered} {\tau _{{{{\rm{f}}}}1}} = {{{c}}_1} + (\sigma - {{{u}}_{\rm{a}}})\tan \varphi \\ {\tau _{{{{\rm{f}}}}2}} = {{{c}}_2} + (\sigma - {{{u}}_{\rm{a}}})\tan \varphi \\ {\gamma _{{{\rm{w}}}}} = {\gamma _{{{\rm{d}}}}}(1 + 0.303{{{S}} _{{{\rm{r}}}}}) \\ \end{gathered} \right. $$ (13) 式中:rw——土体湿重度/(kN·m−3);
rd——土体干重度/(kN·m−3);
Sr——饱和度/%;
τf1、τf2——分段抗剪强度/kPa;
$(\sigma - {{{u}}_{\rm{a}}}) $ ——净法向应力/kPa;ua——孔隙气压力/kPa。
3. 数值模拟结果分析
3.1 路堑边坡浅层塌滑分析
通过FLAC3D软件分别提取不同时刻下M1、M2和M3监测断面的孔隙水压力随深度的变化曲线(图5)。
![]() 图 5 降雨过程中孔隙水压力随深度分布变化曲线Figure 5. Variation curve of pore water pressure distribution with depth during rainfall process
图 5 降雨过程中孔隙水压力随深度分布变化曲线Figure 5. Variation curve of pore water pressure distribution with depth during rainfall process由图5可知降雨过程中,M3监测断面(坡肩)土体的孔隙水压力最先开始变化,M1监测断面(坡脚)土体的孔隙水压力最后开始变化。降雨48 h时,边坡整体暂态饱和区成“J”型分布,其中M1、M3监测断面孔隙水压力变化深度分别为2.5 m和2 m,而M2(坡中)监测断面孔隙水压力变化深度和孔隙水压力开始变化时间均处于两者之间,综上所述可知坡脚部位的暂态饱和区深度高于坡肩。
现基于强度折减法,通过FLAC3D数值软件可得到路堑边坡在降雨前后的最大剪应变增量云图(图6)。
![]() 图 6 降雨前后路堑边坡最大剪应变增量图Figure 6. Maximum shear strain increment of slope before and after rainfall
图 6 降雨前后路堑边坡最大剪应变增量图Figure 6. Maximum shear strain increment of slope before and after rainfall由图6可以看出降雨过程中,路堑边坡的破坏模式由深层整体滑动向浅层局部滑动演化,降雨结束后,路堑边坡的安全系数(Fs)降低了82.32%,这是由于降雨入渗作用导致坡表土体内部孔隙水压力增加,有效应力降低,而且路堑边坡浅层土体由于含水率增加而导致自重增加,两者作用下最终导致坡体中上部浅层土体发生浅层塌滑,这也与现场浅层塌滑情况相吻合。
3.2 路堑边坡安全系数灰色关联度分析
降雨过程中,影响边坡稳定性的外界因素很多,其中降雨强度、坡比和降雨历时是最主要的外界影响因素[4,13]。现在原数值模拟基础上,通过FLAC3D软件分别计算不同坡比、降雨强度和降雨历时条件下边坡的安全系数(表3)。
表 3 边坡降雨前后安全系数Table 3. Safety factor of slope before and after rainfall坡比 降雨
强度/
(mm·h−1)降雨
历时/h初始安全
系数降雨结束时
安全系数1∶0.5 5 24 2.68 2.490 1∶0.75 5 24 2.92 2.750 1∶1 5 24 3.28 3.120 1∶1.25 5 24 3.30 3.180 1∶1 2.5 24 3.28 3.230 1∶1 5 24 3.28 3.120 1∶1 7.5 24 3.28 1.250 1∶1 10 24 3.28 1.110 1∶1 5 12 3.28 3.210 1∶1 5 24 3.28 3.120 1∶1 5 32 3.28 1.575 1∶1 5 48 3.28 0.580 降雨条件下,将边坡稳定性的评价标准可看成外界主要因素的影响函数,假定X1为坡比,X2为降雨强度,X3为降雨历时,降雨前后边坡安全系数变化幅度为Y,边坡安全系数的函数表达式为:
$$ {{{F}}_{{{\rm{s}}}}}{{ = f}}({{{X}}_1}{{,}}{{{X}}_2}{{,}}{{{X}}_3}) $$ (14) 现采用Matlab软件进行灰色关联度分析,根据表3可知外界主要影响因素构成的矩阵为:
$$ {\boldsymbol{X}}{\text{ = }}\left[ \begin{gathered} {X_1} \\ {X_2} \\ {X_3} \\ \end{gathered} \right] = \left[ {\begin{array}{*{20}{c}} 2 &1.33 &1 &0.8 \\ 2.5 &5 &7.5 &10 \\ 12 &24 &32 &48 \end{array}} \right] $$ (15) 降雨过程中边坡安全系数降低幅值矩阵为:
$$ {{{\boldsymbol{Y}} = }}\left[ \begin{gathered} {Y_1} \\ {Y_2} \\ {Y_3} \\ \end{gathered} \right] = \left[ {\begin{array}{*{20}{c}} 0.19 &0.17 &0.16 &0.12 \\ 0.05 &0.16 &2.03 &2.17 \\ 0.07 &0.16 &1.705 &2.7 \end{array}} \right] $$ (16) 分别对因变量矩阵数据和自变量矩阵数据进行均值无量纲和归一化可得:
$$ {\boldsymbol{X}}'{\text{ = }}\left[ \begin{gathered} {X'_1} \\ {X'_2} \\ {X'_3} \\ \end{gathered} \right] = \left[ {\begin{array}{*{20}{c}} 1.559 &1.037 &0.780 &0.624 \\ 0.4 &0.8 &1.2 &1.6\\ 0.4 &0.8 &1.2 &1.6 \end{array}} \right] $$ (17) $$ {{{\boldsymbol{Y}}' = }}\left[ \begin{gathered} {Y'_1} \\ {Y'_2} \\ {Y'_3} \\ \end{gathered} \right] = \left[ {\begin{array}{*{20}{c}} 1.187 &1.063 &1.000 &0.750 \\ 0.045 &0.145 &1.841 &1.968 \\ 0.060 &0.138 &1.471 &2.330 \end{array}} \right] $$ (18) 由式(17)—(18)可得差异序列矩阵
$\Delta_{{mn}} $ 为:$$ \Delta_{{mn}}{{ = }}\left[ {\begin{array}{*{20}{c}} 0.372 &0.025 &0.220 &0.126\\ 0.335 &0.655 &0.641 &0.368\\ 0.340 &0.662 &0.271 &0.730 \end{array}} \right] $$ (19) 根据式(19)可知m=0.022,M=0.663,根据式(6)可得到灰色关联系数矩阵为:
$$ {\boldsymbol{\xi }}{\text{ = }}\left[ {\begin{array}{*{20}{c}} 0.530 &1 &0.667 &0.795\\ 0.543 &0.383 &0.388 &0.533 \\ 0.554 &0.380 &0.614 &0.357 \end{array}} \right] $$ (20) 将式(20)代入式(7)可得到坡比、降雨强度和降雨历时三者与降雨过程中边坡安全系数降低幅度之间的关联度为:
$$ {{{\boldsymbol{r}}}}_{\rm{m}} = {\left[ {\begin{array}{*{20}{c}} {0.748}&{0.462}&{0.476} \end{array}} \right]^{{T}}} $$ (21) 由式(21)可知r1=0.748,r2=0.462,r3=0.476,因此r1>r3>r2,而又由于X1为坡比,X2为降雨强度,X3为降雨历时,故基于灰色关联理论可知坡比对降雨条件下的边坡安全系数影响最大,其余依次为降雨历时和降雨量。
3.3 不同坡比路堑边坡浅层破坏模式
由于坡比是影响降雨条件下路堑边坡安全系数的最大敏感因子,因此在原数值模拟参数(降雨历时为48 h,降雨强度为5 mm/h,坡比为1∶1)基础上,通过FLAC3D软件分别提取降雨48 h后不同坡比的剪应变增量云图(图7)。
![]() 图 7 不同坡比条件下边坡最大剪应变增量图Figure 7. Maximum shear strain increment of slope under different slope ratios
图 7 不同坡比条件下边坡最大剪应变增量图Figure 7. Maximum shear strain increment of slope under different slope ratios对比图6—7可知随着降雨历时的增加,路堑边坡潜在深层滑动面不断向浅层移动,且随着坡比的减小,浅层塌滑区区域逐渐由坡肩部位向坡脚部位移动。分析认为降雨过程中,坡面浅层孔隙水压力升高导致有效应力降低(图5),当路堑边坡的坡比较大时,坡肩冲蚀沟发育程度高,且降雨导致坡体浅层土体的抗剪强度降低,因此受重力因素影响,坡肩部位土体易向临空面发生浅层滑塌;当路堑边坡的坡比较小时,由于受上部土体重力以及坡体内部推力作用,浅层滑塌区域主要集中于坡脚部位;当路堑边坡的坡比值处于两者范围内,浅层滑塌最先开始于坡肩部位,然后逐渐向下延伸至坡面中部,最终形成坡体中上部区域浅层滑塌现象。
4. 室内不同坡度路堑边坡降雨试验
4.1 试验设计方案
试验采用DIK-6000降雨器(图8)进行降雨模拟,仪器有效降雨面积S=1.0404 m2,降雨针管距地面高度为2 m,降雨强度范围为10~80 mm/h[14]。
试验主体部分为长方形模型,见图8(a),模型尺寸为长×宽×高=1.25 m×0.6 m×0.3 m,模型主体采用混凝土制成,土体与混凝土接触面设置隔水塑料板。在数值模拟基础上,将模型主体底部分别放在1∶1.5和1∶1.75坡比底座上,并结合现场防护条件(图1)设置无防护和拱骨架防护2种方案,其中拱骨架的拱圈半径设置为25 cm。坡体整体密度控制在1.89 g/cm3,试验降雨历时为1 h,试验降雨强度设为2 mm/min。
4.2 路堑边坡浅层破坏机制分析
室内降雨过程,由于水流回溯不断侵蚀粉质黏土坡面,而短时间雨水入渗量较少,因此表层土颗粒容易悬浮于水膜之中并被水流裹挟,在边坡表面留下鳞片状沟纹(图9),随着降雨历时的增加,坡面径流不断汇集,而溅击和片蚀而形成的坡面凹陷对水流具有引导作用,在侵蚀后期,径流将坡面表层土体进行软化,坡面凹陷更加明显。当水流冲蚀坡面时,水流回溯不断侵蚀沟槽下方,沟槽上方由于下方土体的流失,沟底土体不能承受上部土体的重力而发生浅层坍塌现象。对比无防护条件下的路堑边坡,拱骨架防护作用会改变径流的方向,减小坡面径流量,对坡面冲蚀具有一定减弱效果,因此拱骨架防护作用下坡脚部位土体强的度劣化程度较低,但在拱骨架的尖角,见图9(b1)和拱顶,见图9(b2)部位会出现土体溜滑现象。
![]()
为进一步分析不同坡比下拱骨架防护作用对边坡浅层土体冲蚀的影响,可引入累计冲蚀降低率[15],其表达式为:
$$ {\delta _t} = \frac{{{S _{{{tx}}}} - {S _{{{ty}}}}}}{{{S _{{{{tx}}}}}}} \times 100\% $$ (22) 式中:δt——t时刻累计冲蚀量降低率/%;
Stx——t时刻无防护条件下累计冲蚀量/kg;
Sty——t时刻拱骨架防护下累计冲蚀量/kg。
由式(22)可得到60 min时不同坡比下累计冲蚀量降低率变化如图10所示。由图10可知拱骨架防护对边坡冲蚀量具有一定抑制作用,在不同坡比条件下,浅层土体累计冲蚀率随时间增长均呈现出先降低后增加的趋势,且坡度越陡,边坡整体累计冲蚀降低率越大。分析认为拱骨架能提高坡体浅层土体的抗冲刷能力,在15 min降雨条件内,坡体浅层土体累计冲蚀量虽不断增加,但在拱骨架防护作用下,坡体浅层土体累计冲蚀量降低率在不断降低,这说明拱骨架在短时间内对抑制坡体浅层土体流失具有一定效果;在15~20 min范围内,坡体浅层土体处于饱和状态而发生软化现象;在20 min后,降雨导致路堑边坡浅层土体强度劣化程度增加,因此雨水更易裹挟土颗粒沿坡面流下,此时拱骨架的防护效果减弱,土体累计冲蚀量降低率不断增加。
![]() 图 10 累计冲蚀量降低率随时间变化关系Figure 10. Relationship between cumulative erosion reduction rate with time
图 10 累计冲蚀量降低率随时间变化关系Figure 10. Relationship between cumulative erosion reduction rate with time5. 路堑边坡浅层塌滑生态防治措施
针对路堑边坡局部浅层塌滑以及拱骨架防护作用下小范围溜滑问题,生态材料防护是一种常见的治理措施[16]。为此,课题组在双达高速现场开展了小范围内生态防护材料试验,选取了4种国内外常见的生态防护材料进行对比分析,在人工搅拌后采用坡面播散或涂抹方法施工,不同材料类型及防护效果对比见表4[17],不同时刻路堑边坡浅层塌滑生态防治效果图见图11。
表 4 不同防护材料及防护效果对比Table 4. Comparison of different protective materials and their effectiveness防护材料名称 主要成分 质量配合比 草种添加量
/(g∙m−2)坡面防护层
厚度/mm路堑边坡浅层塌滑防治效果 HP-FGM
(灵活增长介质)卷曲纤维、木质纤维、
湿润剂和微孔颗粒16∶1∶2∶1 20 ≥30 坡面透气性和透水性最优,初期植被覆盖率最高,
短期内生态防治效果较优,长期应用表现一般素土 素土 — 20 ≥30 短期植被覆盖率一般,坡面透气性和透水性一般,
生态防治效果一般,长期应用表现一般EFM
(工程纤维基质)卷曲与木质纤维
和湿润剂8.1∶1 20 ≥30 坡面透气性和透水性良好,初期植被覆盖率较高,
短期内生态防治效果良好,长期应用表现一般聚丙烯纤维土 聚丙烯纤维
和素土0.003∶1 20 ≥30 坡面透气性和透水性最差,短期植被覆盖率最低,
短期生态防治效果较差,长期应用表现优良对比图11(a)—(e)可知HP-FGM与EFM防护下,短期内路堑边坡植被覆盖率高,而聚丙烯纤维土防护条件下,短期内植被覆盖率低。分析认为HP-FGM与EFM不需要控制压实度,具有较好的透气性和透水性,而边坡所在地降雨又比较充沛,有利于植物的前期快速生长,但聚丙烯纤维土中掺入加筋纤维,需要适当控制压实度,导致防护材料的抗剪强度增加和渗透性较低,故有利于植物的缓慢增长[18]。2019年7月9日,HP-FGM与EFM防护路堑边坡过程中,植被因失水出现一定程度枯萎,而在聚丙烯纤维土防护条件下,路堑边坡植被受影响较小[19 − 20]。2019年11月20日,坡体植被都处于枯萎状态,但对比发现HP-FGM和聚丙烯纤维土防护边坡坡面枯草长度和茂密程度相对较高,且聚丙烯纤维土防护边坡坡面枯草根部甚至保持青色,故聚丙烯纤维土边坡防护材料中植被生长速率虽然比HP-FGM和EFM慢一点,但聚丙烯纤维土边坡防护材料的长期应用表现最为理想。
6. 结 论
(1)土体黏聚力和内摩擦角均随含水率的增加而降低,其强度突变位置处于含水率为12%~18%对应的范围内,基于非饱和土抗剪强度理论可建立以饱和度为变量的分段式抗剪强度公式。
(2)基于灰色关联理论可知坡比、降雨历时和降雨量三者对路堑边坡浅层塌滑的影响程度中,坡比的影响程度最大,降雨历时次之,降雨强度最小。
(3)降雨过程中,路堑边坡潜在深层滑移面逐渐向坡体浅层转移,且浅层塌滑区域受路堑边坡坡比影响,当路堑边坡坡比高于1∶0.75时,边坡浅层塌滑区域靠近坡肩,当路堑边坡坡比低于1∶1.25时,边坡浅层塌滑区域靠近坡脚。
(4)室内降雨试验结果表明拱骨架防护作用会改变径流的方向,减小坡面径流量,对坡面冲蚀具有一定减弱效果,且在此基础上降低路堑边坡坡比对坡面冲蚀能起到进一步减弱效果。
(5)设计适宜的路堑边坡坡比能改变降雨引发的浅层塌滑区域,同时配合拱骨架和聚丙烯纤维加筋土防护作用能较好起到控制路堑边坡浅层塌滑类问题。
-
![]()
图 1 七盘沟泥石流拦挡防治工程分布图
注:1#坝顶长181 m,有效坝高20 m,库容73.9×10⁴ m3;2#坝桩40根,总长323 m,库容4.3×10⁴ m3;3#坝顶长94.8 m,有效坝高10 m;4#坝顶长34.5 m,有效坝高10 m,库容1.4×10⁴ m3;5#坝顶长30.7 m,有效坝高10 m,库容3.4×10⁴ m3;排导槽长
2351 m。Figure 1. Layout map of blocking dams in Qipan gully
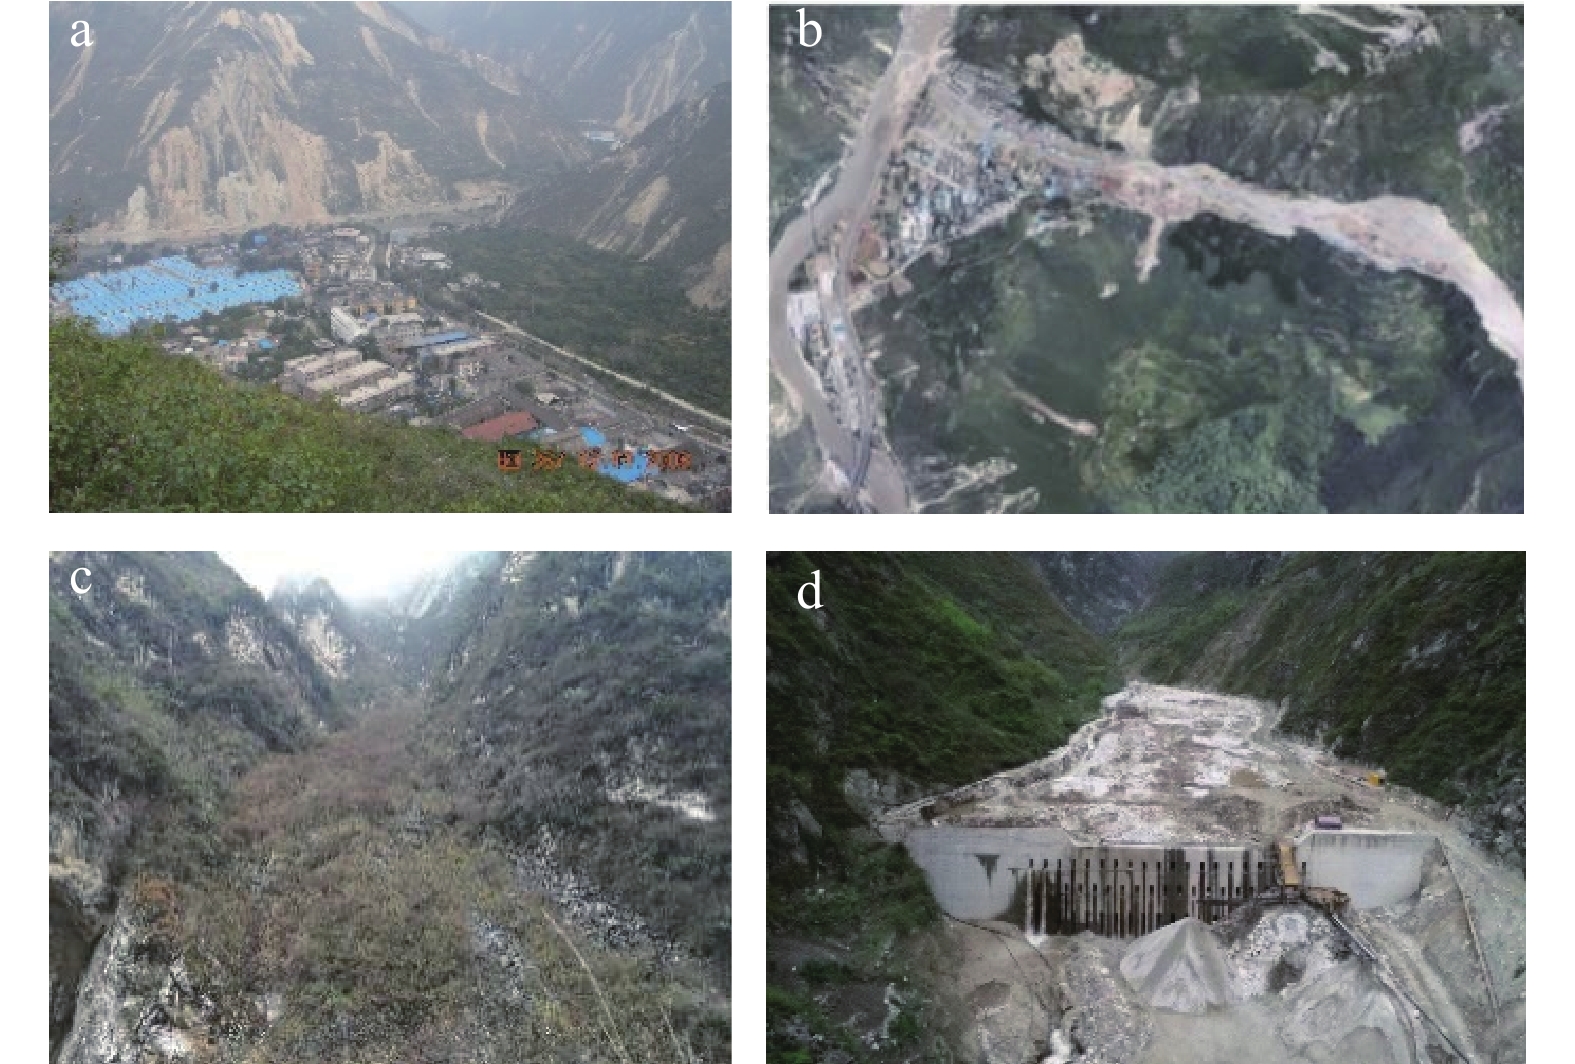
![]()
图 2 七盘沟物源减少途径
注:a为2013年大规模泥石流前(2008.9.12);b为2013年泥石流冲出量;c为植被固源;d为拦挡结构清淤。
Figure 2. Decrease patterns of provenance of debris flow in Qipan gully
![]()
图 3 2005—2019年七盘沟植被覆盖率变化
Figure 3. Changes in vegetation coverage in Qipan gully from 2005 to 2019
![]()
图 4 2005—2019年七盘沟物源遥感解译
Figure 4. Remote sensing interpretation of materials sources in Qipan gully from 2005 to 2019
![]()
图 5 2019年3月18日无人机测试七盘沟情况
注:a为沟道物源;b为沟口建筑物情况;c为3#拦挡坝淤埋情况。
Figure 5. UAV exploration of Qipan gully on March 18, 2019
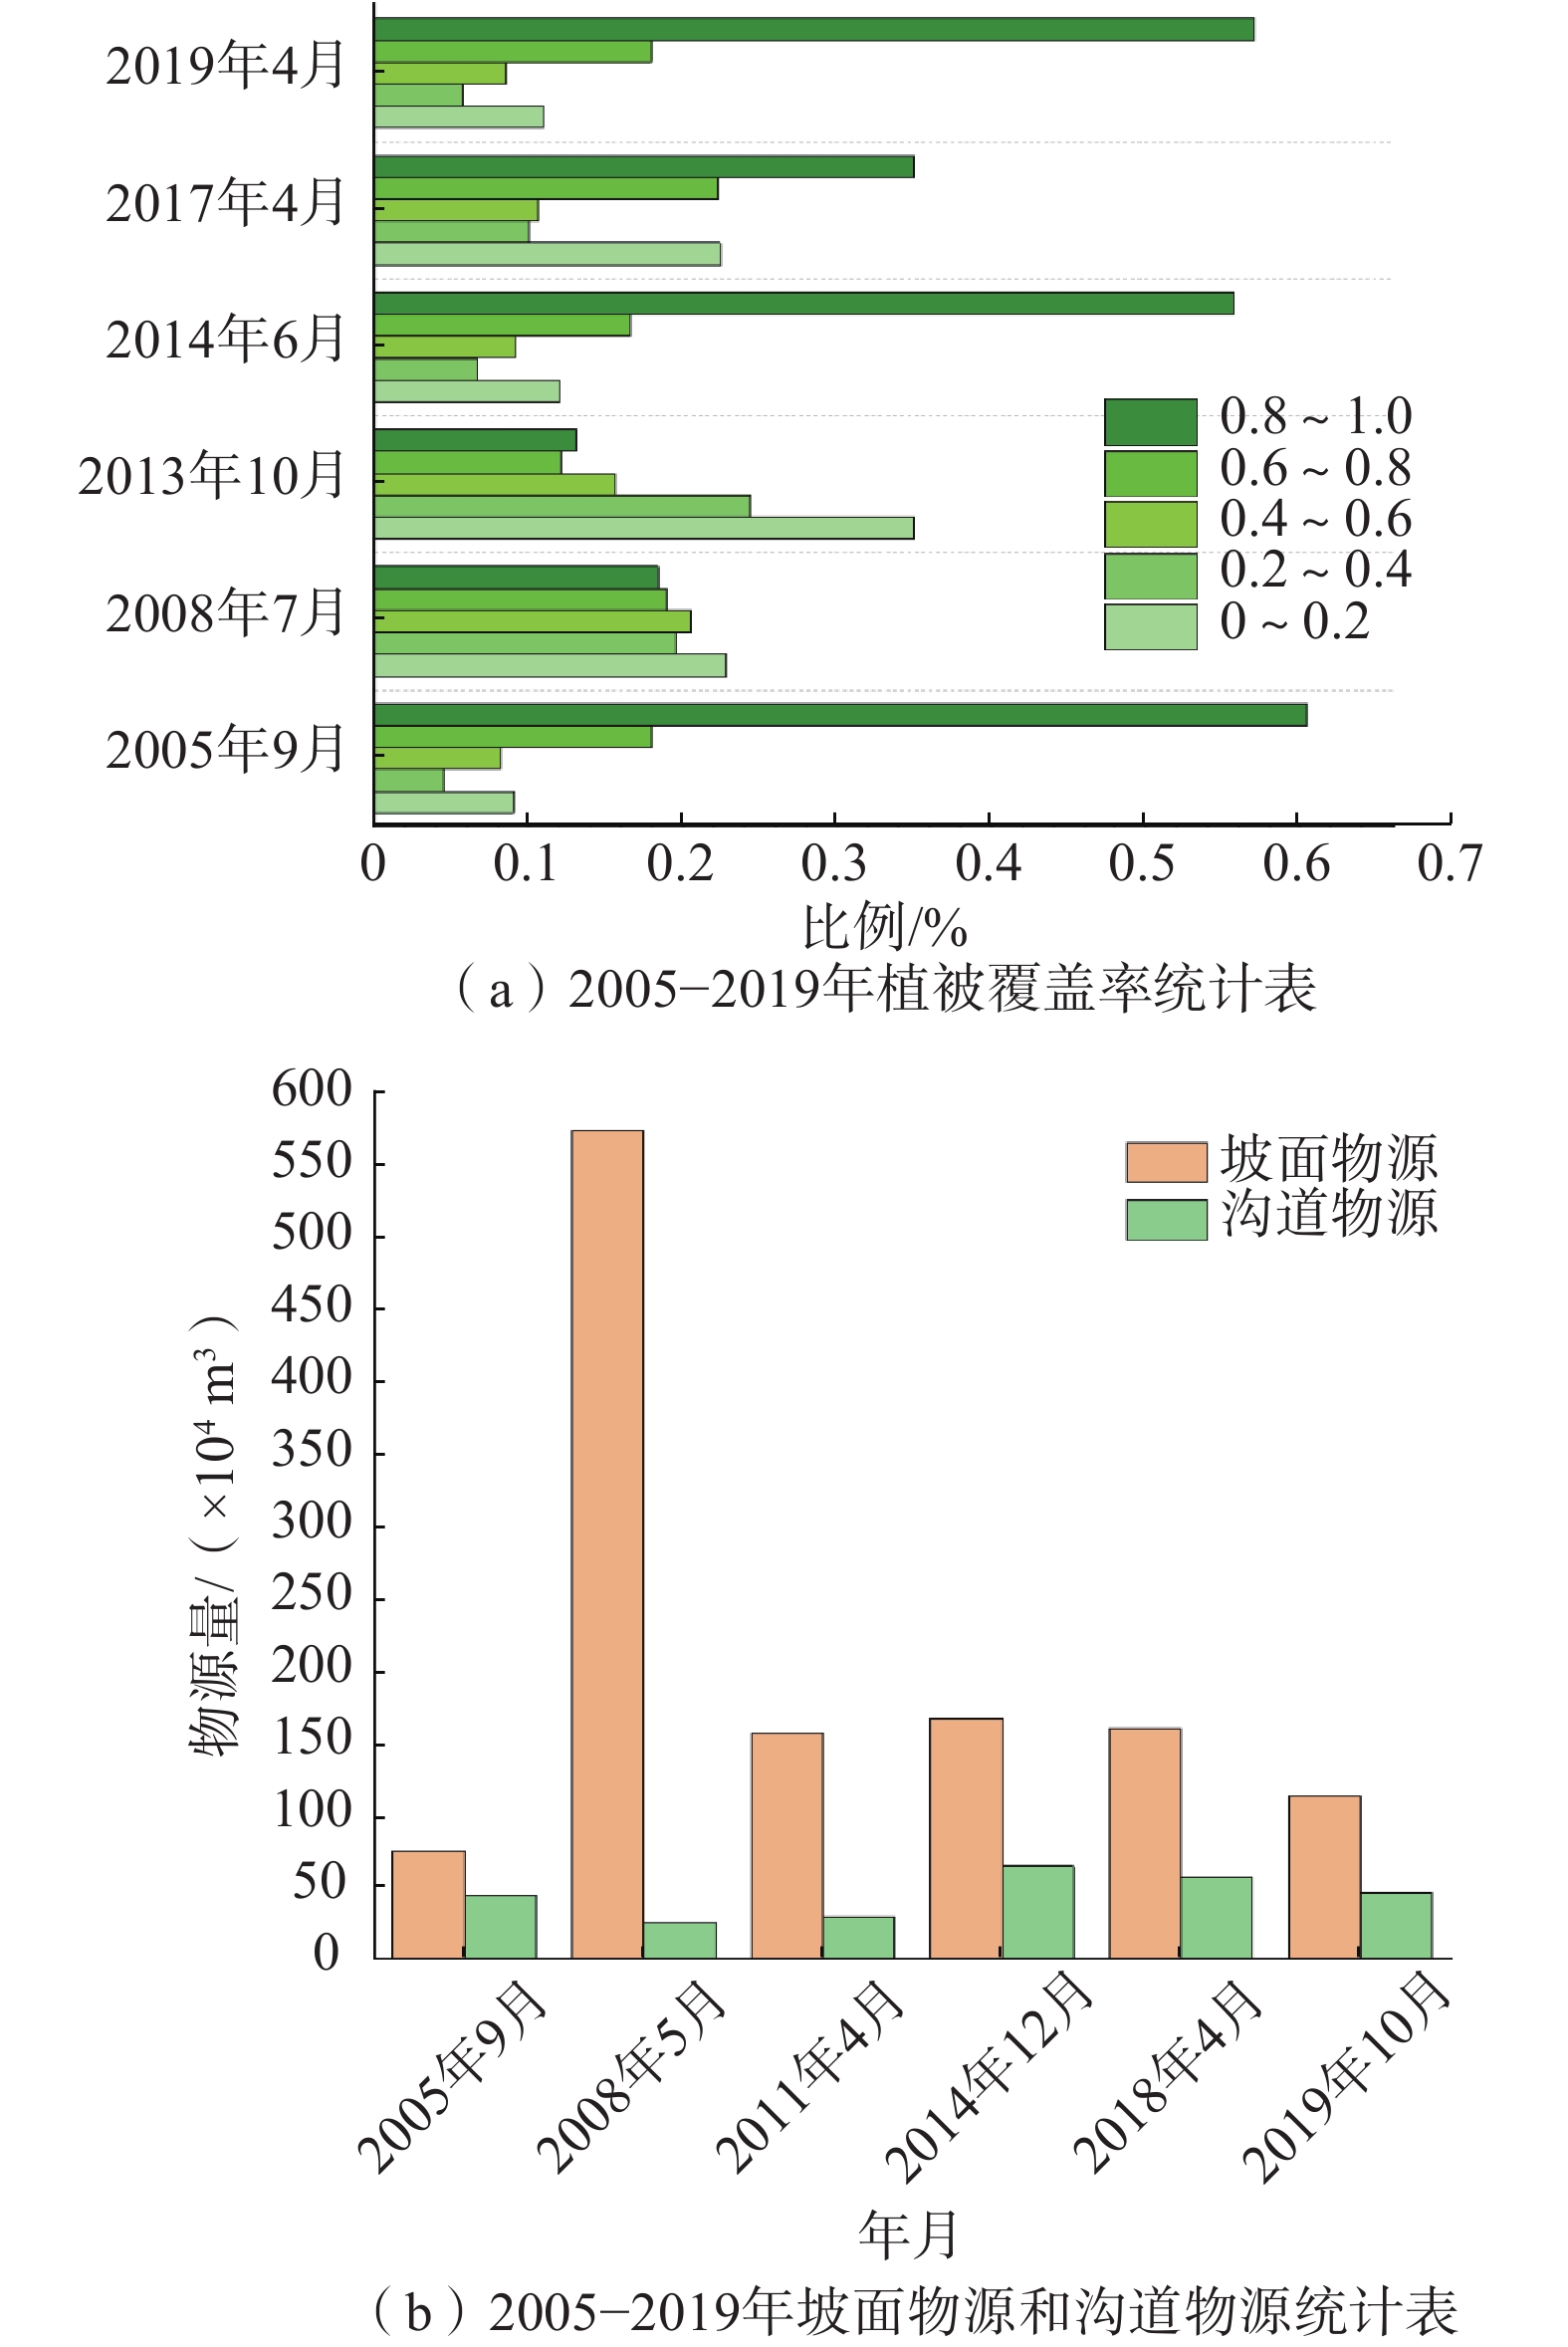
![]()
图 6 泥石流物源统计分析图
Figure 6. Statistical analysis of vegetation coverage and provenance of debris flow in Qipan gully
![]()
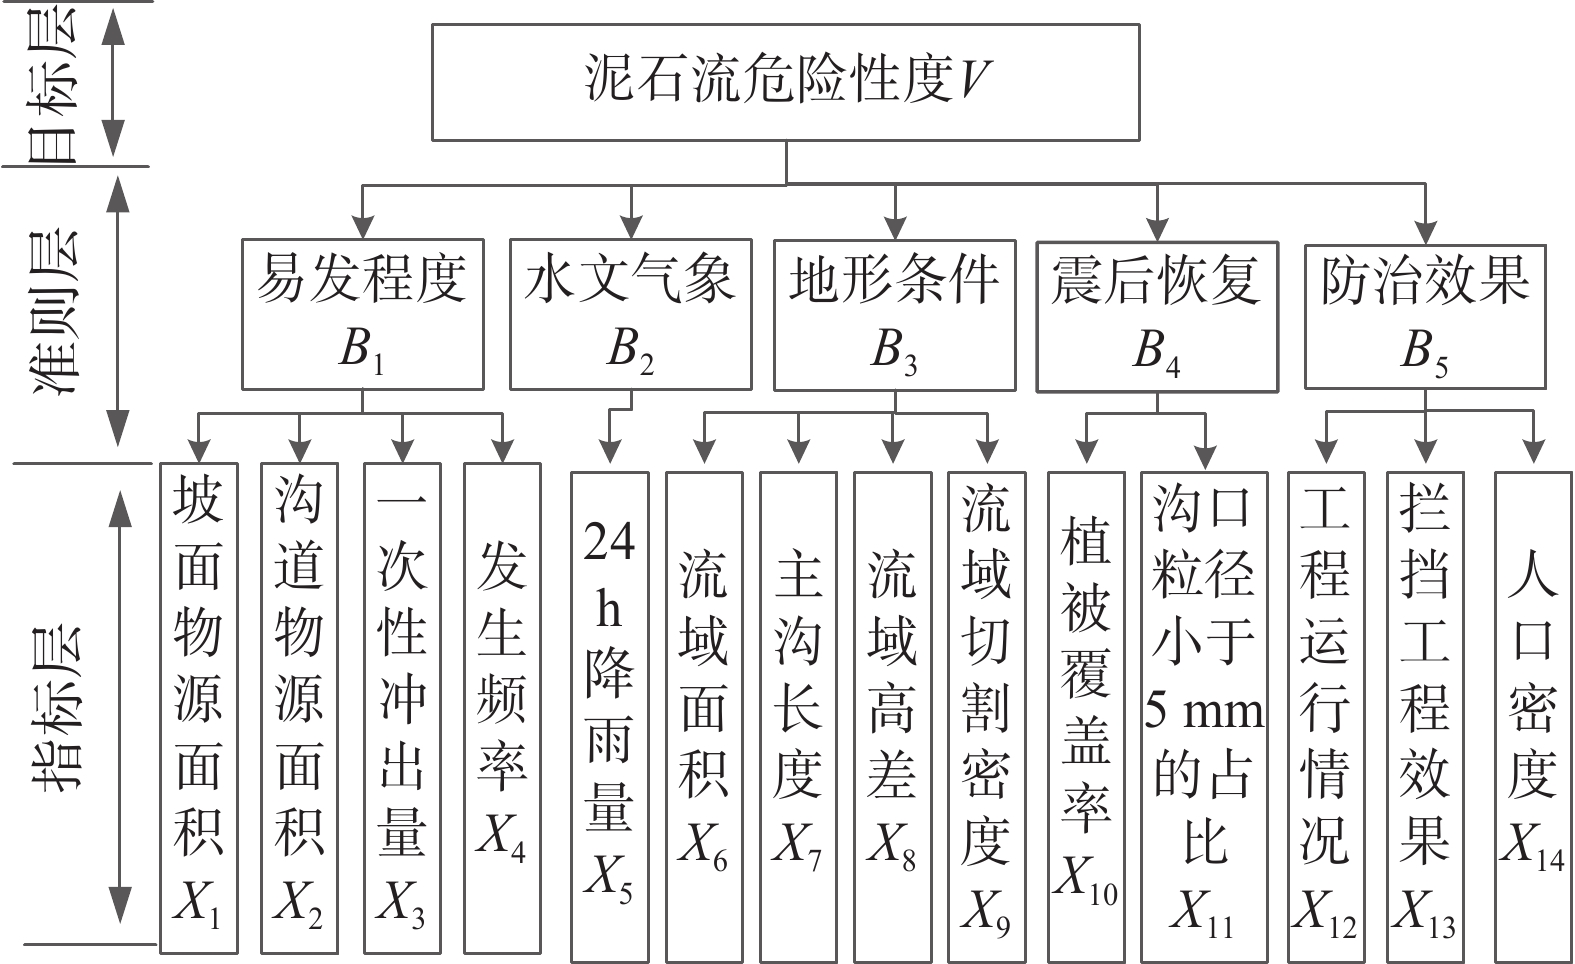
图 7 七盘沟泥石流危险性评价指标体系
Figure 7. Risk assessment indicator system for debris flow in Qipan gully
表 1 七盘沟流域的历史泥石流事件[26]
Table 1 Historical debris-flow events in the Qipan gully watershed, Wenchuan, China
日期 降雨强度/mm 泥石流
类型峰值流量
/(m3·s−1)持续时间
/min泥石流冲出量
/(104 m3)72 h 24 h 1 h 10 min 1933 — — — — 黏性 150 — — 1961-07-06 99.5 79.9 — — 75 60 13.5 1964-07-23 48.3 41.7 — 1.2 稀性 65 50 9.1 1965-07-16 69.5 41.2 — — 65 50 9.9 1970-07-28 56.5 33.0 — — 60 60 5.8 1971-07-24 79.4 53.4 — — 62 45 8.4 1975-07-29 — 32.5 9.6 3.8 81 40 9.8 1977-07-07 — 39.4 7.6 1.6 黏性 65 30 5.8 1978-07-15 79.5 66.7 36.4 17.0 稀性 90 50 13.5 1979-08-15 48.0 30.8 — 6.1 42 30 3.8 1980-07-26 — — — 4.4 65 20 5.4 1981-08-12 — 53.8 9.5 2.1 90 25 6.7 1983-07-19 — 31.3 8.1 1.7 黏性 50 15 2.3 2013-07-11 109.6 54.3 6.4 — 1745 30 78.2 2017-07-05 — 18.6 — — — — 18.5 2018-08-22 — 33.4 — — — — 11.5 2019-08-20 — 28.1 — — — — 15 注:“—” 指数据缺失。  下载: 导出CSV
表 2 七盘沟泥石流危险性因子评价标准及实际值转换
Table 2 Risk assessment criteria and actual value conversion for debris flow factors in Qipan gully
评价指标 极低危险(Ⅰ) 较低危险(Ⅱ) 中等危险(Ⅲ) 较高危险(Ⅳ) 极高危险(Ⅴ) X1 0~25 25~50 50~100 100~250 250~ 1000 X2 0~10 10~20 20~30 30~40 40~60 X3 0~1 1~5 5~10 10~100 100~700 X4 0~5 5~10 10~20 20~100 100~150 X5 0~25 25~50 50~75 50~100 100~500 X6 0~0.5 0.5~5 5~15 15~35 35~70 X7 0~1 1~2 2~5 5~10 10~50 X8 0~0.2 0.2~0.5 0.5~0.7 0.7~1.0 1.0~6.0 X9 0~2 2~5 5~10 10~20 20~100 X10 80~100 80~60 60~40 20~40 0~20 X11 80~100 80~60 60~40 20~40 0~20 X12 0.8~1 0.6~0.8 0.4~0.6 0.2~0.4 0~0.2 X13 0.8~1 0.6~0.8 0.4~0.6 0.2~0.4 0~0.2 X14 0~20 20~50 50~100 100~200 200~ 3000 注:X12[37]:新修(Ⅰ);1/3库容(Ⅱ);2/3库容(Ⅲ);淤满(Ⅳ);未修(Ⅴ)。X13[38]:坝基、坝肩、坝体、溢流口未发生损毁, 排水孔不堵塞(Ⅰ);坝基未被淘蚀, 坝肩、坝体、溢流口有较少部分发生损毁,排水孔不堵塞(Ⅱ);坝基未被淘蚀, 坝肩、坝体、溢流口有较少部分发生损毁,排水孔堵塞较少(Ⅲ);坝基被淘蚀,坝体、坝肩发生损毁,排水孔较少部分未堵塞(Ⅳ);极差 坝基被严重淘蚀,坝肩、坝体破坏严重,排水孔全部堵塞(Ⅴ)。
下载: 导出CSV
表 3 七盘沟泥石流样本实测值
Table 3 Measured value of debris flow samples in Qipan gully
样本 X1 X2 X3 X4 X5 X6 X7 X8 X9 X10 X11 X12 X13 X14 2005 75 34 5 20 26 54.2 15.2 3.04 2.12 60 0.4 0 0 90 2008 574 26 8 22 34 54.2 15.2 3.04 2.12 18 0.09 0 0 65 2011 157 32 8 24 38.3 54.2 15.2 3.04 2.12 24 0.15 0 0 135 2013 581 54 78.2 25 54.3 54.2 15.2 3.04 2.12 13 0.17 0 0 135 2018 149 37 11.5 27 33.4 54.2 15.2 3.04 2.12 34 0.30 0.6 0.8 165 2019 114 33 15 28 28.1 54.2 15.2 3.04 2.12 57 0.37 0.6 0.7 185
下载: 导出CSV
表 4 2005—2019年七盘沟泥石流危险性评价结果
Table 4 Risk assessment results of debris flow in Qipan gully, 2005—2019
年份 危险性评价值 危险级别 Ⅰ Ⅱ Ⅲ Ⅳ Ⅴ 2005 0.0009 0.0046 0.2282 0.1015 0.0237 中等危险 2008 0.0002 0.0126 0.0489 0.0011 0.1572 极高危险 2011 0.0019 0.0019 0.0752 0.1430 0.0936 较高危险 2013 0.0001 0.0002 0.0245 0.1327 0.1657 极高危险 2018 0.0235 0.1280 0.0000 0.2366 0.0006 较高危险 2019 0.0007 0.3534 0.0084 0.1210 0.0005 较低危险
下载: 导出CSV
-
[1] 崔鹏,韦方强,何思明,等. 5•12汶川地震诱发的山地灾害及减灾措施[J]. 山地学报,2008,26(3):280 − 282. [CUI Peng,WEI Fangqiang,HE Siming,et al. Mountain disasters induced by the earthquake of May 12 in Wenchuan and the disasters mitigation[J]. Mountain Research,2008,26(3):280 − 282. (in Chinese with English abstract)] DOI: 10.3969/j.issn.1008-2786.2008.03.006 CUI Peng, WEI Fangqiang, HE Siming, et al. Mountain disasters induced by the earthquake of May 12 in Wenchuan and the disasters mitigation[J]. Mountain Research, 2008, 26(3): 280 − 282. (in Chinese with English abstract) DOI: 10.3969/j.issn.1008-2786.2008.03.006
[2] 许强. 四川省8•13特大泥石流灾害特点、成因与启示[J]. 工程地质学报,2010,18(5):596 − 608. [XU Qiang. The 13 August 2010 catastrophic debris flows in Sichuan Province:Characteristics,genetic mechanism and suggestions[J]. Journal of Engineering Geology,2010,18(5):596 − 608. (in Chinese with English abstract)] DOI: 10.3969/j.issn.1004-9665.2010.05.002 XU Qiang. The 13 August 2010 catastrophic debris flows in Sichuan Province: Characteristics, genetic mechanism and suggestions[J]. Journal of Engineering Geology, 2010, 18(5): 596 − 608. (in Chinese with English abstract) DOI: 10.3969/j.issn.1004-9665.2010.05.002
[3] LI Ning,TANG Chuan,ZHANG Xianzheng,et al. Characteristics of the disastrous debris flow of Chediguan gully in Yinxing Town,Sichuan Province,on August 20,2019[J]. Scientific Reports,2021,11(1):23666. DOI: 10.1038/s41598-021-03125-x
[4] 陈晓清,崔鹏,李泳,等. 汶川地震后北川干溪沟山地灾害及长期发展趋势初步分析[J]. 四川大学学报(工程科学版),2010,42(增刊1):22 − 32. [CHEN Xiaoqing,CUI Peng,LI,Yong,et al. Mountain Hazard Induced by Wenchuan Earthquake and its long-term development trends of Ganxi Gully,Beichuan[J]. Journal of Sichuan University (Engineering Science Edition),2010,42(Sup 1):22 − 32. (in Chinese with English abstract] CHEN Xiaoqing, CUI Peng, LI, Yong, et al. Mountain Hazard Induced by Wenchuan Earthquake and its long-term development trends of Ganxi Gully, Beichuan[J]. Journal of Sichuan University (Engineering Science Edition), 2010, 42(Sup 1): 22 − 32. (in Chinese with English abstract
[5] 黄润秋. 汶川地震地质灾害后效应分析[J]. 工程地质学报,2011,19(2):145 − 151. [HUANG Runqiu. After effect of geohazards induced by the Wenchuan earthquake[J]. Journal of Engineering Geology,2011,19(2):145 − 151. (in Chinese)] DOI: 10.3969/j.issn.1004-9665.2011.02.001 HUANG Runqiu. After effect of geohazards induced by the Wenchuan earthquake[J]. Journal of Engineering Geology, 2011, 19(2): 145 − 151. (in Chinese) DOI: 10.3969/j.issn.1004-9665.2011.02.001
[6] FAN Xuanmei,SCARINGI G,DOMÈNECH G,et al. Two multi-temporal datasets that track the enhanced landsliding after the 2008 Wenchuan earthquake[J]. Earth System Science Data,2019,11(1):35 − 55. DOI: 10.5194/essd-11-35-2019
[7] YANG Wentao,QI Wenwen,ZHOU Jinxing. Decreased post-seismic landslides linked to vegetation recovery after the 2008 Wenchuan earthquake[J]. Ecological Indicators,2018,89:438 − 444. DOI: 10.1016/j.ecolind.2017.12.006
[8] FAN R L,ZHANG L M,WANG H J,et al. Evolution of debris flow activities in Gaojiagou Ravine during 2008–2016 after the Wenchuan earthquake[J]. Engineering Geology,2018,235:1 − 10. DOI: 10.1016/j.enggeo.2018.01.017
[9] CHEN M,TANG C,XIONG J,et al. The long-term evolution of landslide activity near the epicentral area of the 2008 Wenchuan earthquake in China[J]. Geomorphology,2020,367:107317. DOI: 10.1016/j.geomorph.2020.107317
[10] FAN Xuanmei,DOMÈNECH G,SCARINGI G,et al. Spatio-temporal evolution of mass wasting after the 2008 Mw 7.9 Wenchuan earthquake revealed by a detailed multi-temporal inventory[J]. Landslides,2018,15(12):2325 − 2341. DOI: 10.1007/s10346-018-1054-5
[11] LIU Jinfeng,YOU Yong,CHEN Xiaoqing,et al. Mitigation planning based on the prediction of river blocking by a typical large-scale debris flow in the Wenchuan earthquake area[J]. Landslides,2016,13(5):1231 − 1242. DOI: 10.1007/s10346-015-0615-0
[12] 眭海刚,刘超贤,刘俊怡,等. 典型自然灾害遥感快速应急响应的思考与实践[J]. 武汉大学学报(信息科学版),2020,45(8):1137 − 1145. [SUI Haigang,LIU Chaoxian,LIU Junyi,et al. Reflection and exploration of rapid remote sensing emergency response for typical natural disasters[J]. Geomatics and Information Science of Wuhan University,2020,45(8):1137 − 1145. (in Chinese with English abstract)] SUI Haigang, LIU Chaoxian, LIU Junyi, et al. Reflection and exploration of rapid remote sensing emergency response for typical natural disasters[J]. Geomatics and Information Science of Wuhan University, 2020, 45(8): 1137 − 1145. (in Chinese with English abstract)
[13] TANG Chenxiao,LIU Xinlei,CAI Yinghua,et al. Monitoring of the reconstruction process in a high mountainous area affected by a major earthquake and subsequent hazards[J]. Natural Hazards and Earth System Sciences,2020,20(4):1163 − 1186. DOI: 10.5194/nhess-20-1163-2020
[14] CUI Peng,XIANG Lingzhi,ZOU Qiang. Risk assessment of highways affected by debris flows in Wenchuan earthquake area[J]. Journal of Mountain Science,2013,10(2):173 − 189. DOI: 10.1007/s11629-013-2575-y
[15] 侯圣山,曹鹏,陈亮,等. 基于数值模拟的耳阳河流域泥石流灾害危险性评价[J]. 水文地质工程地质,2021,48(2):143 − 151. [HOU Shengshan,CAO Peng,CHEN Liang,et al. Debris flow hazard assessment of the Eryang River watershed based on numerical simulation[J]. Hydrogeology & Engineering Geology,2021,48(2):143 − 151. (in Chinese with English abstract)] HOU Shengshan, CAO Peng, CHEN Liang, et al. Debris flow hazard assessment of the Eryang River watershed based on numerical simulation[J]. Hydrogeology & Engineering Geology, 2021, 48(2): 143 − 151. (in Chinese with English abstract)
[16] 李永威,徐林荣,谷丰宇,等. 孕灾环境对泥石流危险性影响[J/OL]. 地球科学,2022:1 − 12. (2022-03-01)[2024-01-20]. https://kns.cnki.net/kcms/detail/42.1874.P.20220228.1828.004.html. [LI Yongwei,XU Linrong,GU Fengyu,et al. Influence of disaster-prone environment on debris flow risk[J/OL]. Earth Science,2022:1 − 12. (2022-03-01)[2024-01-20]. https://kns.cnki.net/kcms/detail/42.1874.P.20220228.1828.004.html. (in Chinese with English abstract)] LI Yongwei, XU Linrong, GU Fengyu, et al. Influence of disaster-prone environment on debris flow risk[J/OL]. Earth Science, 2022: 1 − 12. (2022-03-01)[2024-01-20]. https://kns.cnki.net/kcms/detail/42.1874.P.20220228.1828.004.html. (in Chinese with English abstract)
[17] 殷启睿,苏娜. 基于DEA冗余分析的泥石流危险度评价[J]. 中国地质灾害与防治学报,2020,31(3):30 − 34. [YIN Qirui,SU Na. Debris-flow risk assessment based on DEA redundancy analysis[J]. The Chinese Journal of Geological Hazard and Control,2020,31(3):30 − 34. (in Chinese with English abstract)] YIN Qirui, SU Na. Debris-flow risk assessment based on DEA redundancy analysis[J]. The Chinese Journal of Geological Hazard and Control, 2020, 31(3): 30 − 34. (in Chinese with English abstract)
[18] 周亮,何晓英,晋云超,等. 泥石流拦挡坝工程服役性能特征分析——以甘肃省陇南市武都区为例[J]. 中国地质灾害与防治学报,2023,34(6):37 − 46. [ZHOU Liang,HE Xiaoying,JIN Yunchao,et al. Analysis of service performance characteristics of debris flow check dams:A case study in Wudu District,Longnan City,Gansu Province[J]. The Chinese Journal of Geological Hazard and Control,2023,34(6):37 − 46. (in Chinese with English abstract)] ZHOU Liang, HE Xiaoying, JIN Yunchao, et al. Analysis of service performance characteristics of debris flow check dams: A case study in Wudu District, Longnan City, Gansu Province[J]. The Chinese Journal of Geological Hazard and Control, 2023, 34(6): 37 − 46. (in Chinese with English abstract)
[19] 龙玉洁,李为乐,黄润秋,等. 汶川地震震后10 a绵远河流域滑坡遥感自动提取与演化趋势分析[J]. 武汉大学学报(信息科学版),2020,45(11):1792 − 1800. [LONG Yujie,LI Weile,HUANG Runqiu,et al. Automatic extraction and evolution trend analysis of landslides in Mianyuan River Basin in the 10 years after Wenchuan earthquake[J]. Geomatics and Information Science of Wuhan University,2020,45(11):1792 − 1800. (in Chinese with English abstract)] LONG Yujie, LI Weile, HUANG Runqiu, et al. Automatic extraction and evolution trend analysis of landslides in Mianyuan River Basin in the 10 years after Wenchuan earthquake[J]. Geomatics and Information Science of Wuhan University, 2020, 45(11): 1792 − 1800. (in Chinese with English abstract)
[20] 李志,陈宁生,侯儒宁,等. 基于机器学习的伊犁河谷黄土区泥石流易发性评估[J]. 中国地质灾害与防治学报,2024,35(3):129 − 140. [LI Zhi,CHEN Ningsheng,HOU Runing,et al. Susceptibility assessment of debris flow disaster based on machine learning models in the loess area along Yili Valley[J]. The Chinese Journal of Geological Hazard and Control,2024,35(3):129 − 140. (in Chinese with English abstract)] LI Zhi, CHEN Ningsheng, HOU Runing, et al. Susceptibility assessment of debris flow disaster based on machine learning models in the loess area along Yili Valley[J]. The Chinese Journal of Geological Hazard and Control, 2024, 35(3): 129 − 140. (in Chinese with English abstract)
[21] 汪明武,王霄,龙静云,等. 基于多维联系正态云模型的泥石流危险性评价[J]. 应用基础与工程科学学报,2021,29(2):368 − 375. [WANG Mingwu,WANG Xiao,LONG Jingyun,et al. Risk assessment of debris flow based on multidimensional connection normal cloud model[J]. Journal of Basic Science and Engineering,2021,29(2):368 − 375. (in Chinese with English abstract)] WANG Mingwu, WANG Xiao, LONG Jingyun, et al. Risk assessment of debris flow based on multidimensional connection normal cloud model[J]. Journal of Basic Science and Engineering, 2021, 29(2): 368 − 375. (in Chinese with English abstract)
[22] 严惊涛,刘树光. 基于组合赋权的对地攻击无人机自主能力云模型评价[J]. 北京航空航天大学学报,2023,49(12):3500 − 3510. [YAN Jingtao,LIU Shuguang. Combination weighting based cloud model evaluation of autonomous capability of ground-attack UAV[J]. Journal of Beijing University of Aeronautics and Astronautics,2023,49(12):3500 − 3510. (in Chinese with English abstract)] YAN Jingtao, LIU Shuguang. Combination weighting based cloud model evaluation of autonomous capability of ground-attack UAV[J]. Journal of Beijing University of Aeronautics and Astronautics, 2023, 49(12): 3500 − 3510. (in Chinese with English abstract)
[23] 曾超,崔鹏,葛永刚,等. 四川汶川七盘沟“7•11” 泥石流破坏建筑物的特征与力学模型[J]. 地球科学与环境学报,2014,36(2):81 − 91. [ZENG Chao,CUI Peng,GE Yonggang,et al. Characteristics and mechanism of buildings damaged by debris flows on 11 July,2013 in qipangou of Wenchuan,Sichuan[J]. Journal of Earth Sciences and Environment,2014,36(2):81 − 91. (in Chinese with English abstract)] ZENG Chao, CUI Peng, GE Yonggang, et al. Characteristics and mechanism of buildings damaged by debris flows on 11 July, 2013 in qipangou of Wenchuan, Sichuan[J]. Journal of Earth Sciences and Environment, 2014, 36(2): 81 − 91. (in Chinese with English abstract)
[24] HU Tao,HUANG Runqiu. A catastrophic debris flow in the Wenchuan Earthquake area,July 2013:Characteristics,formation,and risk reduction[J]. Journal of Mountain Science,2017,14(1):15 − 30. DOI: 10.1007/s11629-016-3965-8
[25] 袁亚东. 强震区“宽缓” 型沟道物源起动机理及动储量评价研究——以七盘沟为例[D]. 绵阳:西南科技大学,2020. [YUAN Yadong. Study on provenance starting mechanism and dynamic reserve evaluation of “wide and slow” channel in strong earthquake area:Taking Qipangou as an example[D]. Mianyang:Southwest University of Science and Technology,2020. (in Chinese with English abstract)] YUAN Yadong. Study on provenance starting mechanism and dynamic reserve evaluation of “wide and slow” channel in strong earthquake area: Taking Qipangou as an example[D]. Mianyang: Southwest University of Science and Technology, 2020. (in Chinese with English abstract)
[26] HU Xudong,YANG Feng,HU Kaiheng,et al. Estimating the debris-flow magnitude using landslide sediment connectivity,Qipan catchment,Wenchuan County,China[J]. Catena,2023,220:106689. DOI: 10.1016/j.catena.2022.106689
[27] 七盘沟泥石流勘查报告[R]. 四川:四川省蜀通岩土工程公司,2013 [Investigation of emergency actions to mitigate debris flow hazards in the Qipan Gully, Wenchuan County, Aba Prefecture, Sichuan Province[R]. Sichuan: Sichuan Shutong geotechnical engineering company,2013. (in Chinese)] Investigation of emergency actions to mitigate debris flow hazards in the Qipan Gully, Wenchuan County, Aba Prefecture, Sichuan Province[R]. Sichuan: Sichuan Shutong geotechnical engineering company, 2013. (in Chinese)
[28] 张伟 , 吴鄂, 刘宁鉴. 七盘沟滑坡泥石流勘查报告[R]. 四川:四川省华地建设工程有限责任公司. 2008. [ZHANG Wei, WU E, LIU Ningjian. Field investigation report on emergency management project of landslide and debris flow in the Qipan gully in Wenchuan county,Aba Prefecture,Sichuan Province[R]. the Sichuan Huadi Construction Engineering Co. Ltd,2008. (in Chinese)] ZHANG Wei, WU E, LIU Ningjian. Field investigation report on emergency management project of landslide and debris flow in the Qipan gully in Wenchuan county, Aba Prefecture, Sichuan Province[R]. the Sichuan Huadi Construction Engineering Co. Ltd, 2008. (in Chinese)
[29] SHI Qingyun,TANG Chuan,GONG Lingfeng,et al. Activity evolution of landslides and debris flows after the Wenchuan earthquake in the Qipan catchment,Southwest China[J]. Journal of Mountain Science,2021,18(4):932 − 951. DOI: 10.1007/s11629-020-6494-4
[30] 李敬强,樊天辰,周妍汝,等. 基于云模型的民航监察员队伍能力综合评价[J]. 北京航空航天大学学报,2022,48(12):2425 − 2433. [LI Jingqiang,FAN Tianchen,ZHOU Yanru,et al. Comprehensive evaluation on capability of civil aviation supervisor team based on cloud model[J]. Journal of Beijing University of Aeronautics and Astronautics,2022,48(12):2425 − 2433. (in Chinese with English abstract)] LI Jingqiang, FAN Tianchen, ZHOU Yanru, et al. Comprehensive evaluation on capability of civil aviation supervisor team based on cloud model[J]. Journal of Beijing University of Aeronautics and Astronautics, 2022, 48(12): 2425 − 2433. (in Chinese with English abstract)
[31] YANG Fan,FAN Xuanmei,SIVA SUBRAMANIAN S,et al. Catastrophic debris flows triggered by the 20 August 2019 rainfall,a decade since the Wenchuan earthquake,China[J]. Landslides,2021,18(9):3197 − 3212. DOI: 10.1007/s10346-021-01713-6
[32] ZHU Jing,TANG Chuan,CHANG Ming,et al. Field observations of the disastrous 11 July 2013 debris flows in qipan gully,Wenchuan area,southwestern China[C]//Engineering Geology for Society and Territory - Volume 2. Cham:Springer International Publishing,2015:531 − 535.
[33] CHEN Ming,TANG Chuan,LI Mingwei,et al. Changes of surface recovery at coseismic landslides and their driving factors in the Wenchuan earthquake-affected area[J]. Catena,2022,210:105871. DOI: 10.1016/j.catena.2021.105871
[34] ZHANG Xianzheng,TANG Chenxiao,LI Ning,et al. Investigation of the 2019 Wenchuan County debris flow disaster suggests nonuniform spatial and temporal post-seismic debris flow evolution patterns[J]. Landslides,2022,19(8):1935 − 1956. DOI: 10.1007/s10346-022-01896-6
[35] GUZZETTI F,ARDIZZONE F,CARDINALI M,et al. Distribution of landslides in the upper Tiber River Basin,central Italy[J]. Geomorphology,2008,96(1/2):105 − 122.
[36] 叶小兵. 强震区震后泥石流坡面物源起动机制研究[D]. 绵阳:西南科技大学,2020. [YE Xiaobing. Study on provenance starting mechanism of debris flow slope after earthquake in strong earthquake area[D]. Mianyang:Southwest University of Science and Technology,2020. (in Chinese with English abstract)] YE Xiaobing. Study on provenance starting mechanism of debris flow slope after earthquake in strong earthquake area[D]. Mianyang: Southwest University of Science and Technology, 2020. (in Chinese with English abstract)
[37] 王念秦,韩波,庞琦,等. 泥石流防治工程效果后评价初探[J]. 工程地质学报,2015,23(2):219 − 226. [WANG Nianqin,HAN Bo,PANG Qi,et al. Post-evaluation model on effectiveness of debris flow control[J]. Journal of Engineering Geology,2015,23(2):219 − 226. (in Chinese with English abstract)] WANG Nianqin, HAN Bo, PANG Qi, et al. Post-evaluation model on effectiveness of debris flow control[J]. Journal of Engineering Geology, 2015, 23(2): 219 − 226. (in Chinese with English abstract)
[38] 张文涛,柳金峰,游勇,等. 泥石流防治工程损毁度评价——以汶川地区为例[J]. 中国地质灾害与防治学报,2022,33(4):77 − 83. [ZHANG Wentao,LIU Jinfeng,YOU Yong,et al. Damage evaluation of control works against debris flow:A case study in Wenchuan area[J]. The Chinese Journal of Geological Hazard and Control,2022,33(4):77 − 83. (in Chinese with English abstract)] ZHANG Wentao, LIU Jinfeng, YOU Yong, et al. Damage evaluation of control works against debris flow: A case study in Wenchuan area[J]. The Chinese Journal of Geological Hazard and Control, 2022, 33(4): 77 − 83. (in Chinese with English abstract)


计量
- 文章访问数: 348
- HTML全文浏览量: 12
- PDF下载量: 27
 邮件订阅
邮件订阅 RSS
RSS