

Formation mechanism and hazard assessment of debris flow in Yizhong River, Deqin County, Yunnan Province
-
摘要:
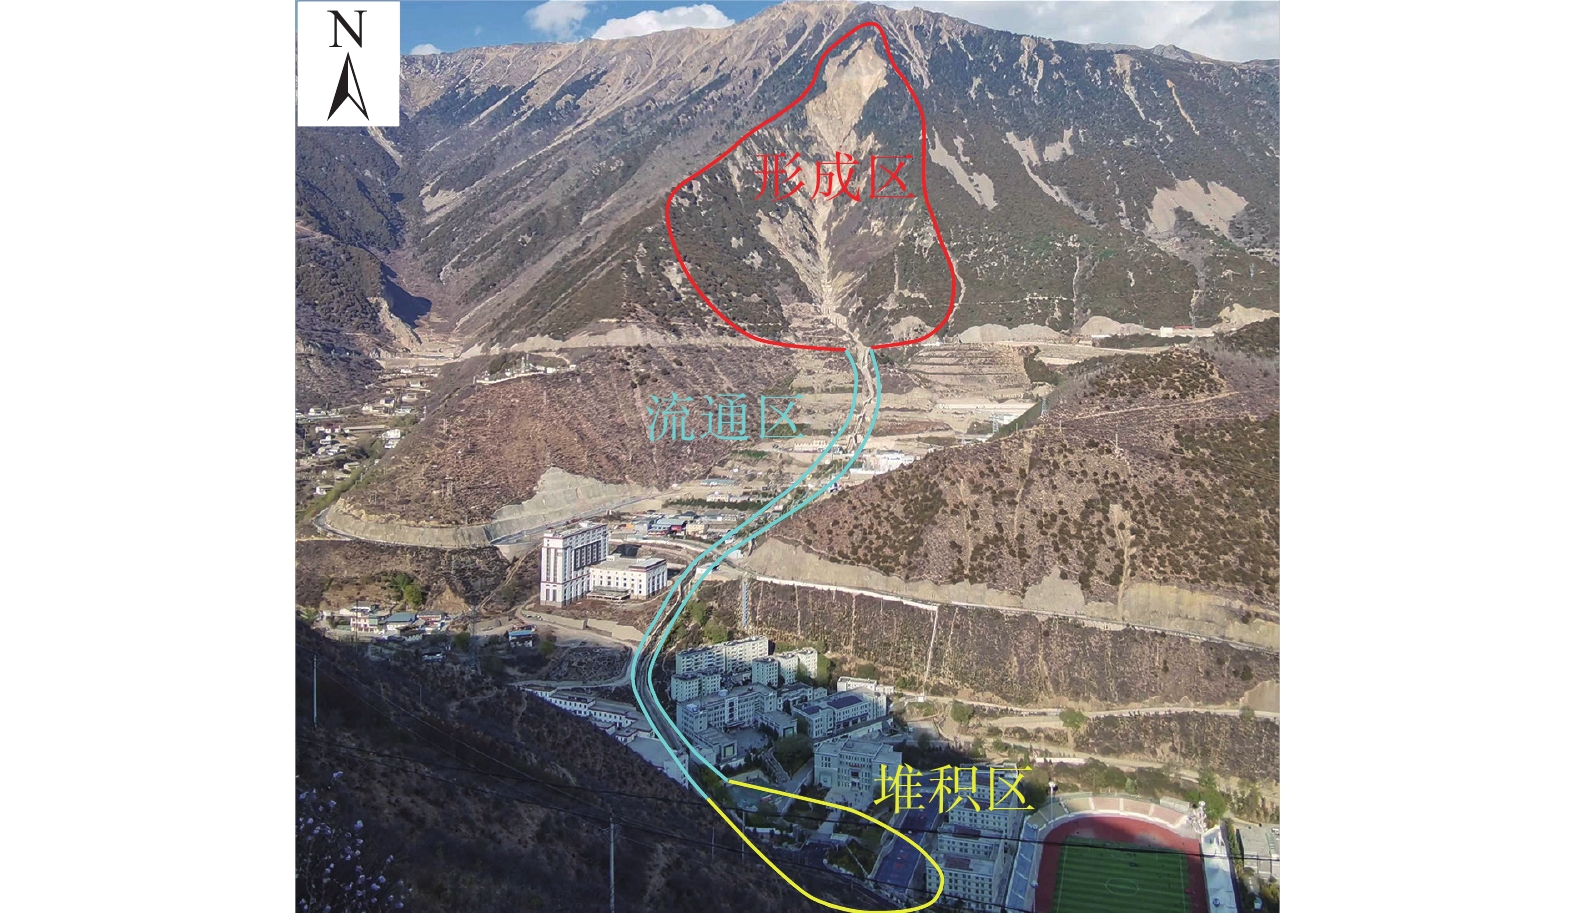
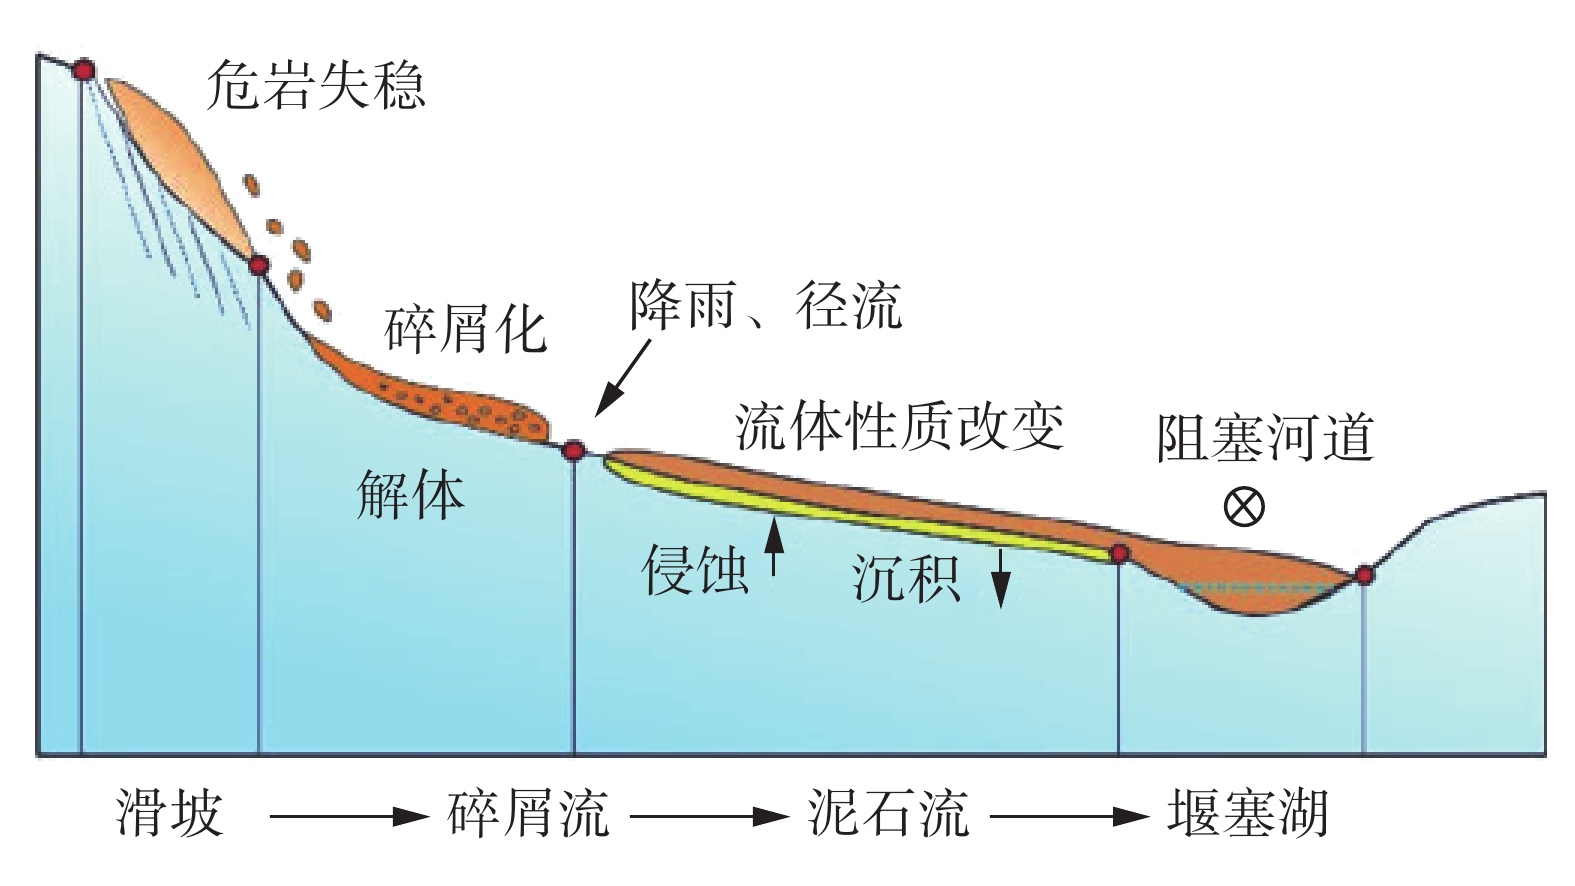
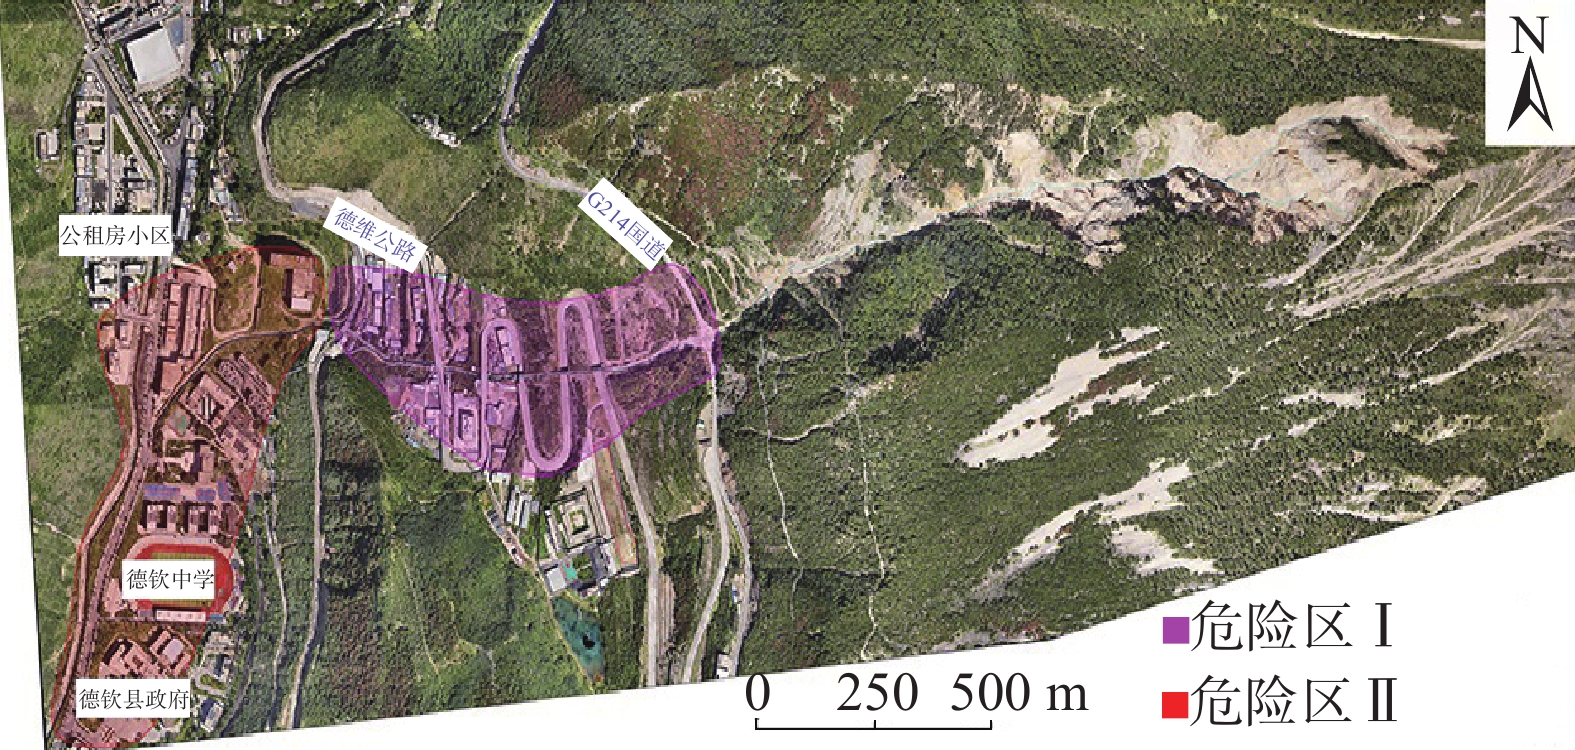
云南省德钦县是我国遭受泥石流灾害最严重的地区之一。德钦县一中河曾多次暴发大规模的泥石流灾害,对沟口处居民区及G214国道造成严重破坏和巨大经济损失。为探明一中河上游源区潜在物源在暴雨+地震工况下形成泥石流灾害的危险区范围和启动机制,在现场调查和成因分析的基础上,以无人机贴近摄影成果高精度的DEM为地形数据,运用RAMMS软件对暴雨+地震工况下体积为16.05×10⁴ m3的泥石流进行模拟,划定了一中河流域内两处危险区,并阐述了一中河泥石流灾害成灾模式。研究结果表明:一中河泥石流属于高原山区沟谷型黏性泥石流,具有规模大、高易发、危害大的特点,其成灾机制概括为高位崩滑体-碎屑流-泥石流-堰塞湖-溃决洪水的沟谷灾害链;危险区Ⅰ位于G214国道至德维路区域,危险区Ⅱ为沟口区域,此区域易发生堆积和堵塞,危险性极高;泥石流运动过程中最大流速达23.93 m/s,最大冲击力为
1000 kPa,最大堆积深度为9.33 m,泥石流一次最大冲出体积约8×10⁴ m3,危险区范围约0.31 km2。结果可为一中河泥石流治理工程提供科学依据,对德钦县地质灾害综合防治能力提升具有重要实际意义。Abstract:Deqin County in Yunnan Province is among the most severely affected regions in China by debris flow disasters. The Yizhong River in Deqin County has witnessed numerous large-scale debris flow disasters, causing significant damage and substantial economic losses to residential areas and the G214 national road. To elucidate the range of hazard zones and initiation mechanisms of debris flow disaster triggered by potential sources in the upstream Yizhong River under conditions of heavy rainfall and earthquakes, this study conducted field investigations and causal analyses. High-precision Digital Elevation Model (DEM) data derived from close-range UAV aerial photography were utilized as topographic data. The RAMMS software simulated a debris flow of 16.05×10⁴ m3 under heavy rain and earthquake conditions. Two hazardous zones within the Yizhong River Basin were delineated, and the disaster initiation mode of debris flow in Yizhong River was expounded. The results show that the debris flow in Yizhong River belongs to the gully-type viscous debris flow typical of plateau mountainous regions, characterized by large scale, high frequency, and severe impact. Its disaster mechanism is summarized as a gully and valley disaster chain involving high-altitude landslide, debris flow, dammed lake, and flood breach. Risk zone I is located in the area from G214 national road to Dewei Road, while risk zone II is in the gully mouth area prone to accumulation and blockage, presenting high risk. During debris flow movement, the maximum flow velocity reached 23.93 m/s, maximum impact force was
1000 kPa, maximum accumulation depth was 9.33 m, and the maximum single outburst volume of debris flow was approximately80000 m3, with a danger area of about 0.31 km2. The research results provide a scientific basis for debris flow control projects in Yizhong River and are of practical significance for improving the comprehensive prevention and control of geological hazards in Deqin County.-
Keywords:
- Deqin County /
- debris flow /
- G214 national road /
- disaster mechanism /
- risk zone /
- numerical simulation
-
0. 引言
地基稳定性受多种因素影响[1 − 2],特别是黄土地区,受震陷影响很大。黄土震陷作为一种严重的地质灾害,一旦发生将会造成非常严重的后果。前人对与黄土震陷的研究基本是以动三轴试验为主,以单个震陷量作为震陷性的主要的评价指标[3 − 6]。然而黄土地基震陷的准确性评价受到土性参数不确定性的影响,其中物理力学指标的概率分布类型和变异性会对评价结果产生影响。针对岩土工程中参数、计算模型、荷载等不确定性问题,其主要的不确定性分析方法包括:概率分析方法[7]、随机有限元法[8]、灰色系统评价法[9]、模糊数学法[10]、神经网络评价方法[11]等。这些不确定性方法可以考虑得更加全面,从而提高评价结果的准确性,使结果更为科学合理。
关于黄土震陷在不确定性方面的研究,李波等[12]采用灰色关联方法和逐步判别方法建立了耦合式软土震陷判别模型从而实现软土震陷等级的判定。在黄土震陷概率评价方面,谭芳[13]将概率地震危险性分析方法引入震陷计算中,采用不确定性分析方法分析了黄土震陷与地震参数之间的关系,从而提出一种考虑地震随机性的黄土震陷预测方法。任森等[14]基于大量动三轴试验,结合场地地震危险性概率分析方法,确定了研究区内的震陷区划。孙军杰等[15]依据残余应变估算模型采用概率统计等非确定性分析方法对地基动力沉降进行了概率分析。可见概率分析方法在土体动力沉降中已经得到了初步研究。
然而到目前为止,还没有研究将可靠度理论应用于黄土地基震陷的分析中。因此本文尝试将可靠度理论应用于黄土地基震陷评价中,使用可靠度方法对黄土地基震陷性进行分析。可靠度方法和传统的确定性分析方法相互补充与结合,有助于进行震陷可靠度分析。
1. 黄土地基震陷可靠度指标
可靠度理论在边坡稳定分析中被广泛应用,而边坡工程的不确定因素主要为土体参数的抗剪强度(内摩擦角、黏聚力)[16 − 18]。其依托蒙特卡洛分析法通过计算出多组安全系数值将小于1的安全系数的次数与计算次数的比值称作失效概率。因此可求得对应的可靠度指标($ \mathrm{\beta } $)为:
$$ \beta ={\varPhi }^{-1}(1-{P}_{\text{f}}) $$ (1) 式中:$ \varPhi $——标准正态分布的累计分布函数;
${P_{\text{f}}}$——失效概率。
在目前已有的地震灾害评估中,尚未有关于地基震陷量的标准划分依据。根据中国地震局发布的《震害调查及地震损失评定工作指南》,可以采用“地基基础破坏等级标准”来评估震陷灾害的程度[16],将震陷量小于2 cm的定义为基本完好,震陷量大于40 cm的定义为破坏。
参考可靠度理论在边坡稳定性评价中的应用,结合黄土动力学对震陷等级的划分,本文提出了一种对黄土地基震陷评价的可靠度指标。
(1)最大可靠度
在震陷等级划分中将震陷量大于40 cm的定义为震陷破坏,因此可采用破坏概率(Pd)来判定其震陷破坏状态,即$ {P_{\mathrm{d}}} = P\left( {S \geqslant 40} \right) $。将$ \beta_{\mathrm{d}} $定义为:
$$ {\beta _{\mathrm{d}}} = \frac{{40 - {u_{\mathrm{s}}}}}{{{\sigma _{\mathrm{s}}}}} $$ (2) 式中:$ {u_{\mathrm{s}}} $——震陷量的平均值;
$ {\sigma _{\mathrm{s}}} $——震陷量的标准差。
如果震陷量符合标准正态分布,破坏概率与可靠度的关系可表示为:
$$ {P_{\mathrm{d}}} = P\left( {S > 40} \right) = 1 - \varPhi \left(\frac{{40 - {u_{\mathrm{s}}}}}{{{\sigma _{\mathrm{s}}}}}\right) = 1 - \varPhi ({\beta _{\mathrm{d}}}) $$ (3) 则根据可靠度理论,将破坏概率对应的可靠度称为最大可靠度(${\beta }_{\text{d}} $),也就是指衡量地基震陷最大安全程度的标准,其计算公式为:
$$ {\beta }_{\text{d}}={\varPhi }^{-1}(1-{P}_{\text{d}}) $$ (4) 根据蒙特卡罗可靠度计算方法可定义破坏概率为:
$$ {P_{\text{d}}} = \frac{M}{N} $$ (5) 式中:$ {P}_{{\mathrm{d}}} $——地基震陷破坏概率;
M——抽样次数中震陷量大于40 cm的次数;
N——蒙特卡洛分析法总的抽样次数。
(2)最小可靠度
在震陷等级划分中将震陷量小于2 cm的定义为基本完好,因此可采用完好概率(Ph)来判定其完好状态,即$ {P_{\mathrm{h}}} = P\left( {S \leqslant 2} \right) $。将$ {\beta _{\mathrm{h}}} $定义为:
$$ {\beta _{\mathrm{h}}} = \frac{{2 - {u_{\mathrm{s}}}}}{{{\sigma _{\mathrm{s}}}}} $$ (6) 式中:$ {u_{\mathrm{s}}} $——震陷量的平均值;
$ {\sigma _{\mathrm{s}}} $——震陷量的标准差。
如果震陷量符合标准正态分布,完好概率(Ph)与可靠度的关系可表示为:
$$ {P_{\mathrm{h}}} = P\left( {S < 2} \right) = \varPhi \left(\frac{{2 - {u_{\mathrm{s}}}}}{{{\sigma _{\mathrm{s}}}}}\right) = \varPhi ({\beta _{\mathrm{h}}}) $$ (7) 根据可靠度理论,将完好概率对应的可靠度称为最小可靠度(${\beta _{\mathrm{h}}} $),也就是指衡量地基震陷完好程度的标准,其计算公式为:
$$ {\beta _{\text{h}}} = {\varPhi ^{ - 1}}\left( {{P_{\text{h}}}} \right) $$ (8) 根据蒙特卡罗可靠度计算方法可定义完好概率为:
$$ {P_{\text{h}}} = \frac{M}{N} $$ (9) 式中:$ {P}_{{\mathrm{h}}} $——地基完好概率;
M——抽样次数中震陷量小于2 cm的次数;
N——蒙特卡洛分析法总的抽样次数。
2. 基于Kriging代理模型的震陷可靠度计算
2.1 Kriging代理模型的建立
Kriging模型是一种基于方差最小的无偏估计方法,它的原理是通过已知样本点的线性加权法来预测未知点的函数值,即已知加权系数插值就可求得变量空间内任一点的函数值。Kriging代理模型通常情况下由回归部分和随机误差两部分所组成。将其用输出变量S(x)与输入变量x表示为:
$$ S({\boldsymbol{x}}) = \sum\limits_{i = 1}^m {{\beta _i}} f({\boldsymbol{x}}) + {\textit{z}}({\boldsymbol{x}}) = f{({\boldsymbol{x}})^T}{\boldsymbol{\beta}} + {\textit{z}}({\boldsymbol{x}}) $$ (10) 式中:每个样本点中输入变量的个数为n,$ {\boldsymbol{x}} = [ {x_1},{x_2}, \cdots , {x_n} ]^T$,$ f(x) = {\left[ {{f_1}(x),{f_2}(x), \cdots ,{f_m}(x)} \right]^T} $为回归多项式基函数向量,m为回归多项式的数量;${\boldsymbol{\beta}} = {[{\beta _1},{\beta _2},\cdots,{\beta _m}]^T}$为多项式参数向量,z(x)为一均值为0,方差为$ {\sigma ^2} $的正态随机过程,该随机过程的协方差为:
$$ COV\left[{\textit{z}}(u),{\textit{z}}(v)\right]={\sigma }^{2}R({u,v}) $$ (11) 其中,R表示任意两点u,v的相关函数,通常取为高斯相关方程,即:
$$ R(u,v) = \exp \left\{ { - \theta {{(u - v)}^2}} \right\} $$ (12) 其中,$ \theta $为相关参数,可通过最大似然估计得到:
$$ \theta=\max \left\{ { - \left[ {\frac{1}{2}\ln \left( {\left| R \right|} \right)} \right] + \frac{k}{2}\ln \left( {{\sigma ^2}} \right)} \right\} $$ (13) 其中,R为相关矩阵,元素R=R(u,v)。
基于给定的样本点,多项式参数向量$\beta $与随机过程方差$ {\sigma ^2} $的估计值分别为:
$$ \left\{ {\begin{split} & {\hat {\boldsymbol{\beta}} = {{\left( {{{\boldsymbol{F}}^T}{{\boldsymbol{R}}^{ - 1}}{\boldsymbol{F}}} \right)}^{ - 1}}{{\boldsymbol{F}}^T}{{\boldsymbol{R}}^{ - 1}}{\boldsymbol{Y}}} \\ & {{{\hat {\boldsymbol{\sigma}} }^2} = \frac{1}{k}{{\left( {{\boldsymbol{Y}} - {\boldsymbol{F}}\hat {\boldsymbol{\beta}} } \right)}^T}{{\boldsymbol{R}}^{ - 1}}\left( {{\boldsymbol{Y}} -{\boldsymbol{ F}}\hat {\boldsymbol{\beta}} } \right)} \end{split}} \right. $$ (14) 其中,F为由回归多项式函数值构成的矩阵。
对于任意输入变量$ {x_0} $,假定$ {x_0} $与输入变量样本X之间的相关系数向量为$ {{\boldsymbol{r}}_0} = {\left[ {R\left( {{x_0},{x_1}} \right), \cdots ,R\left( {{x_0},{x_k}} \right)} \right]^T} $利用式(10)构建的Kriging模型表达式,可以得到与$ {x_0} $对应的系统响应值$ S({x_0}) $的预测值$ \hat S({x_0}) $服从正态分布$ N(\hat S({x_0}),{\hat \sigma _{\hat S}}^2({x_0})) $,$ S({x_0}) $的最佳线性无偏估计及均方误差可表示为:
$$ \left\{ {\begin{split} &{\hat S\left( {{x_0}} \right) = {f^T}({x_0})\hat {\boldsymbol{\beta}} + {{\boldsymbol{r}}_0}^T{{\boldsymbol{R}}^{ - 1}}({\boldsymbol{Y}} - {\boldsymbol{F}}\hat {\boldsymbol{\beta }})} \\ & {{{\hat \sigma }^2}_{\hat S}({x_0}) = {{\hat \sigma }^2}\left( {1 + {{\boldsymbol{u}}^T}{{({{\boldsymbol{F}}^T}{{\boldsymbol{R}}^{ - 1}}{\boldsymbol{F}})}^{ - 1}}{\boldsymbol{u}} - {{\boldsymbol{r}}_0}^T{{\boldsymbol{R}}^{ - 1}}{{\boldsymbol{r}}_0}} \right)} \end{split}} \right. $$ (15) 其中,$ {{{\boldsymbol{u}} = }}{{{{\boldsymbol{F}}}}^T}{{\boldsymbol{R}}^{ - 1}}{{\boldsymbol{r}}_0} - {\boldsymbol{f}} $。
本文进行震陷可靠度分析时,式(10)—(15)中应用Kriging模型构建和预测其过程,采用MATLAB中的DACE工具箱实现。
2.2 黄土地基数值模型
采用FLAC3D有限差分软件建立黄土地基数值模型,模型尺寸设置为15 m×15 m×15 m,模型网格数为
3375 ,本构模型选择Mohr-Coulomb弹塑性本构模型。在静力分析时,底面和侧面选用固定边界,限制底面与侧面的位移和速度,顶部为自由边界。动力分析与静力分析不同,由于地震荷载会存在波的反射,因此在模型底面设置静态边界,侧面设置为自由场边界,模拟土体在实际中的状态(图1)。本文选用三条地震波分别是Kobe地震波、Imperial地震波和一条人工合成波。为方便后续说明,这里将选用的三条地震波分别命名为地震波1、地震波2及地震波3。地震波1的持续时间为25 s,时间间隔为0.02 s,最大加速度为0.345g,地震波2的持续时间为40 s,时间间隔为0.01 s,最大加速度为0.313g,地震波3的持续时间为20 s,时间间隔为0.02 s,最大加速度为0.153g。图2为经过滤波以及基线校正后所选地震波的时程曲线。
为了研究不同地震水平作用下震陷变形规律,将其改变幅值的大小来满足不同工况的需要,得到 0.1g、0.2g、0.3g、0.4g、0.5g、0.6g、0.7g不同峰值加速度大小的7种水平。其计算所得震陷量结果如表1所示。
表 1 不同地震波及不同峰值加速度作用下地基震陷量Table 1. Seismic subsidence of foundation under different seismic waves and peak accelerations.峰值加速度/g 震陷量/cm 地震波1 地震波2 地震波3 0.1 0.72 1.95 2.65 0.2 2.37 8.40 13.44 0.3 9.10 16.02 21.62 0.4 17.83 21.44 29.52 0.5 19.78 25.29 37.06 0.6 20.08 30.67 40.98 0.7 20.48 35.84 46.98 2.3 震陷变形影响因素敏感性分析
岩土体材料参数存在着变异性,但土体泊松比的变异系数非常小,在考虑土性参数不确定时可将其看作常量。孙军杰等[17]通过理论分析,给出了非饱和黄土动残余应变与黏聚力、内摩擦角、初始孔隙比、土层重度、土层埋深以及地震动荷载之间的定量关系式。压缩模量是体现土体压缩性的指标之一,作为土体的力学性质,在分析地基土体变形或沉降时起着重要作用,而土体的黏聚力和内摩擦角反映土体的强度特征,在静力分析中,黄土地基静力参数中密度对于计算结果的影响较明显。因此,这里选择密度、弹性模量、黏聚力及内摩擦角四种参数。采用FLAC3D结合灰色关联分析对影响黄土地基震陷变形的因素做敏感性分析,求得其密度、弹性模量、黏聚力及摩擦角四个参数的灰色关联度为$ q = [ {0.656\;8},\;{0.856\;2},\;{0.668\;5},\;{0.728\;1} ] $,敏感性排序为:弹性模量>内摩擦角>黏聚力>密度。
2.4 土性参数分布概率模型
本节选取密度(ρ)、压缩模量(Es)、黏聚力(c)及内摩擦角(φ)四种参数作为黄土震陷性评价的参数指标来进行分布概率模型研究。为了全面分析不同地貌单元4种土性参数的最优概率分布,选用可以包含大部分不确定性因素的概率分布形式包括正态分布、对数正态分布和威布尔分布进行假设检验。从而确定每个参数的最优概率分布形式[18]。
为获取原状黄土地基土性不同参数的分布概率模型,基于引汉济渭工程的渭河二级阶地地貌土体为例,通过对原状黄土的各种物理力学指标进行统计分析,得出各指标服从的概率密度函数及分布参数,图3所示为渭河二级阶地分布概率模型图,其中$ f\left( x \right) $表示概率密度函数。
![]() 图 3 不同参数的概率密度分布图Figure 3. Probability density distribution plots of different parameters
图 3 不同参数的概率密度分布图Figure 3. Probability density distribution plots of different parameters由图3可知,从分布形态上来看,$ \rho $值的正态分布和对数正态分布整体较一致,两者均属于左偏态;其余三种土性参数正态分布、对数正态分布及威布尔分布三者分布较离散,差异性较大。
通过K-S检验法对4种土性参数的3种分布概率模型进行检验,求出样本值的理论累计概率分布与经验累计概率分布的最大差值(Dmax),与由显著性水平和样本数确定临界值($ D_n^\alpha $)进行比较,计算结果如表2所示。四种参数均可接受正态分布、对数正态分布和威布尔分布。$ c $、$ {E_{\mathrm{s}}} $值的最优分布是正态分布,$ \varphi $、$ \rho $值的最优分布是威布尔分布,考虑到正态分布的优良性质,将正态分布作为4种土性参数的分布概率模型用于震陷可靠度计算。
表 2 分布假设检验结果Table 2. Distribution hypothesis test results检验参数 样本量 验证结果$ {D_{\max }} $ 可接受的临界值
$ D_n^\alpha /\left( {\alpha = 0.05} \right) $正态分布 对数正态分布 威布尔分布 结果 $ {D_{\max }} $ 结果 $ {D_{\max }} $ 结果 $ {D_{\max }} $ 内摩擦角 24 √ 0.180 √ 0.223 √ 0.093 0.273 黏聚力 24 √ 0.099 √ 0.125 √ 0.102 0.273 压缩模量 24 √ 0.094 √ 0.146 √ 0.164 0.273 密度 48 √ 0.150 √ 0.185 √ 0.115 0.196 2.5 基于Kriging代理模型的震陷可靠度计算方法
本节基于Kriging代理模型对地基震陷可靠度进行计算,这里进行
10000 次模拟,计算步骤如下:(1)根据前文统计出的土性参数(密度、压缩模量、黏聚力、摩擦角)的概率分布模型,确定地基土体参数的均值、标准差、分布类型等统计特性。
(2)FLAC3D6.0内置有Python编程语言,可以实现蒙特卡洛抽样与连续计算,利用Itasca开发的专门用于Python扩展编程的程序库,通过编程实现随机变量拉丁超立方抽样(LHS)、模型的建立以及计算,即会产生N组计算方案$ \left(\rho_1,E_{\mathrm{s}1},c_1,\varphi_1\right),\left(\rho_2,E_{\mathrm{s}2},c_2,\varphi_2\right),\cdots,(\rho_n,E_{\mathrm{s}n},c_n, \varphi_n) $,然后计算出对应的响应值。将计算模型文件保存为“n.f3sav”,后续模型按顺序编号,并将其作为源文件以便后续提取。
(3)对地震波设计不同的工况组合,计算每组工况下LHS的样本所对应的震陷量,并保存计算模型。
(4)利用Python编程语言从结果文件中批量提取竖向变形。
(5)采用MATLAB软件分别建立不同工况下的Kriging代理模型,以4种土体参数为输入,相应的地基震陷量为输出,对代理模型进行训练,得到满足精度要求的代理模型。经适当训练的代理模型能够较好地逼近实际情况,在此基础上可以十分方便地预测震陷值从而实现震陷可靠度的计算(图4)。
![]() 图 4 基于Kriging代理模型的震陷可靠度计算流程Figure 4. Calculation process of seismic subsidence reliability based on the Kriging surrogate model
图 4 基于Kriging代理模型的震陷可靠度计算流程Figure 4. Calculation process of seismic subsidence reliability based on the Kriging surrogate model3. 算例分析
为验证本文提出方法的适用性,本节以引汉济渭工程为背景结合Kriging代理模型的震陷概率计算方法开展黄土地基震陷可靠度分析。
(1)最大可靠度
表3为不同地震波及不同地震峰值加速度作用下地基震陷的破坏概率,以渭河二级阶地为例。
表 3 不同地震波作用下地基震陷破坏概率Table 3. Probability of foundation subsidence failure under different seismic wave effects加速度/g 地震波1 地震波2 地震波3 0.1 0 0 0 0.2 0 0 0 0.3 0 0 0 0.4 0 0.072 0.116 0.5 0 0.17 0.378 0.6 0 0.232 0.704 0.7 0.002 0.264 0.888 由表3可知,在地震波1的作用下,该地基土体在地震波峰值加速度为0.7g时会出现破坏的概率,在地震波2和地震波3的作用下,在峰值加速度达到0.4g时会出现破坏的概率。三条地震波在峰值加速度达到最大时,其产生的破坏概率也有巨大差异,地震波1在峰值加速度为0.7g时破坏概率为0.002,地震波2在峰值加速度为0.7g时破坏概率为0.264,地震波3在峰值加速度为0.7g时破坏概率为0.888。
依据式(4)求得最大可靠度指标,图5为不同地震波作用下地基震陷的可靠度指标随峰值加速度的变化规律,最大可靠度指标的范围为−1.216~4.526。总体上可靠度指标随峰值加速度的增加呈非线性减小。但三条地震波的减小斜率并不相同,在地震波3作用下,可靠度指标随峰值加速度的变化斜率最大,说明在地震波3作用下,地基的可靠度受地震波峰值加速度的影响最大。对于已知地震波峰值加速度,可以快速粗略估计地基震陷的破坏概率,而不是单纯以震陷量来评价,这在风险评估中具有更为重要的意义。
![]() 图 5 可靠度分析获得的地基震陷最大可靠度Figure 5. Maximum reliability index of foundation seismic subsidence obtained from reliability analysis
图 5 可靠度分析获得的地基震陷最大可靠度Figure 5. Maximum reliability index of foundation seismic subsidence obtained from reliability analysis(2)最小可靠度
表4为不同地震波及不同地震峰值加速度作用下地基震陷的破坏概率,以渭河二级阶地为例。由表4可知,在地震波1的作用下,该地基土体在地震波峰值加速度为0.1g~0.7g时均会出现完好概率,在地震波2和地震波3的作用下,在峰值加速度分别达到0.4g及以后和0.3g及以后完好概率均为0。
表 4 不同地震波作用下地基震陷完好概率Table 4. Probability of intact seismic subsidence of foundation under different seismic wave effects加速度/g 地震波1 地震波2 地震波3 0.1 0.946 0.854 0.842 0.2 0.392 0.094 0.832 0.3 0.238 0.004 0 0.4 0.01 0 0 0.5 0.018 0 0 0.6 0.012 0 0 0.7 0.002 0 0 依据式(8)求得最小可靠度指标,图6为在不同地震波作用下地基震陷的最小可靠度随峰值加速度的变化规律,最小可靠度指标的变化范围为−2.878~1.607。从整体来说,随着地震峰值加速度的增大,地基在地震作用下的最小可靠度指标逐渐降低。当地震峰值加速度为0.1g时,震陷最小可靠度较高,都为正值;当地震峰值加速度为0.2g时,地震最小可靠度显著减小,且超过0.2g以后最小可靠度均为负值。
![]() 图 6 可靠度分析获得的地基震陷的最小可靠度指标Figure 6. Minimum reliability index of foundation seismic subsidence obtained from reliability analysis
图 6 可靠度分析获得的地基震陷的最小可靠度指标Figure 6. Minimum reliability index of foundation seismic subsidence obtained from reliability analysis(3)变异系数对震陷可靠度的影响
为了更好地分析随机变量的变异性大小对震陷可靠度的影响,本文计算了各变量在不同变异系数组合情况下,四种土体参数变异系数随地基震陷可靠度的变化情况,工况组合见表5。
表 5 各参数变异系数工况组合表Table 5. Combination table of variation coefficient for each parameter工况 COV 密度 弹性模量 黏聚力 摩擦角 1-1 0.01 0.3 0.2 0.3 1-2 0.05 1-3 0.1 1-4 0.15 1-5 0.2 2-1 0.05 0.05 0.2 0.3 2-2 0.1 2-3 0.2 2-4 0.3 2-5 0.4 3-1 0.05 0.3 0.05 0.3 3-2 0.1 3-3 0.2 3-4 0.3 3-5 0.4 4-1 0.05 0.3 0.2 0.1 4-2 0.2 4-3 0.3 4-4 0.4 4-5 0.5 计算结果如图7所示。由图可知,随各参数变异系数的增加,震陷最大可靠度逐渐减小,而最小可靠度逐渐增大。当$ COV(\rho) $从0.01增加至0.2,相应的$ {\beta _{\text{d}}} $从3.72减小至3.05,最小可靠度($ {\beta _{\text{h}}} $)从−1.72增加至−1.55,降幅为21.97%,增幅为10.96%;当$ COV(E_{\mathrm{s}}) $从0.05增加至0.4,相应的$ {\beta _{\text{d}}} $从3.89降至3.29,$ {\beta _{\text{h}}} $从−1.89增加至−1.64,降幅为18.24%,增幅为15.24%;当$ COV(c) $从0.05增加至0.4,$ {\beta _{\text{d}}} $从4.26降至2.89,$ {\beta _{\text{h}}} $从−1.81增加至−1.60,降幅为47.40%,增幅为13.13%;当$ COV(\varphi)$从0.1增加至0.5,$ {\beta _{\text{d}}} $从3.72降至2.74,$ {\beta _{\text{h}}} $从−1.99增加至−1.63,降幅为35.77%,增幅为22.09%。对比数据,在同样的增幅下,最大可靠度的变化幅度比最小可靠度的变化幅度大说明最大可靠度对变异系数更为敏感。计算各个参数最大可靠度起末两点斜率的绝对值,分别为3.526、1.714、3.914和2.45,可看出黏聚力变异系数对震陷最大可靠度影响更为显著。
![]() 图 7 不同参数变异系数对震陷可靠度的影响规律Figure 7. The influence of different parameter coefficient of variations on seismic subsidence reliability
图 7 不同参数变异系数对震陷可靠度的影响规律Figure 7. The influence of different parameter coefficient of variations on seismic subsidence reliability4. 结论
(1)Kriging代理模型可以在小样本抽样的情况下得到较好的近似拟合效果,达到精度要求,提高了震陷可靠度的计算效率。
(2)采用震陷可靠度方法来评价地基土体的震陷性,能够合理地考虑土性参数的变异性,更加符合实际情况,具有更好的可靠性和适用性,对于已知地震波峰值加速度,可以快速粗略估计地基震陷的破坏概率,而不是单纯的以震陷量来评价,这在风险评估中具有更为重要的意义。
(3)综合4种土体参数的变异系数对震陷可靠度的影响可以发现,最大可靠度对各个参数的变异系数更为敏感,此外四种土体参数中黏聚力的变异系数对震陷最大可靠度的影响更为显著。
-
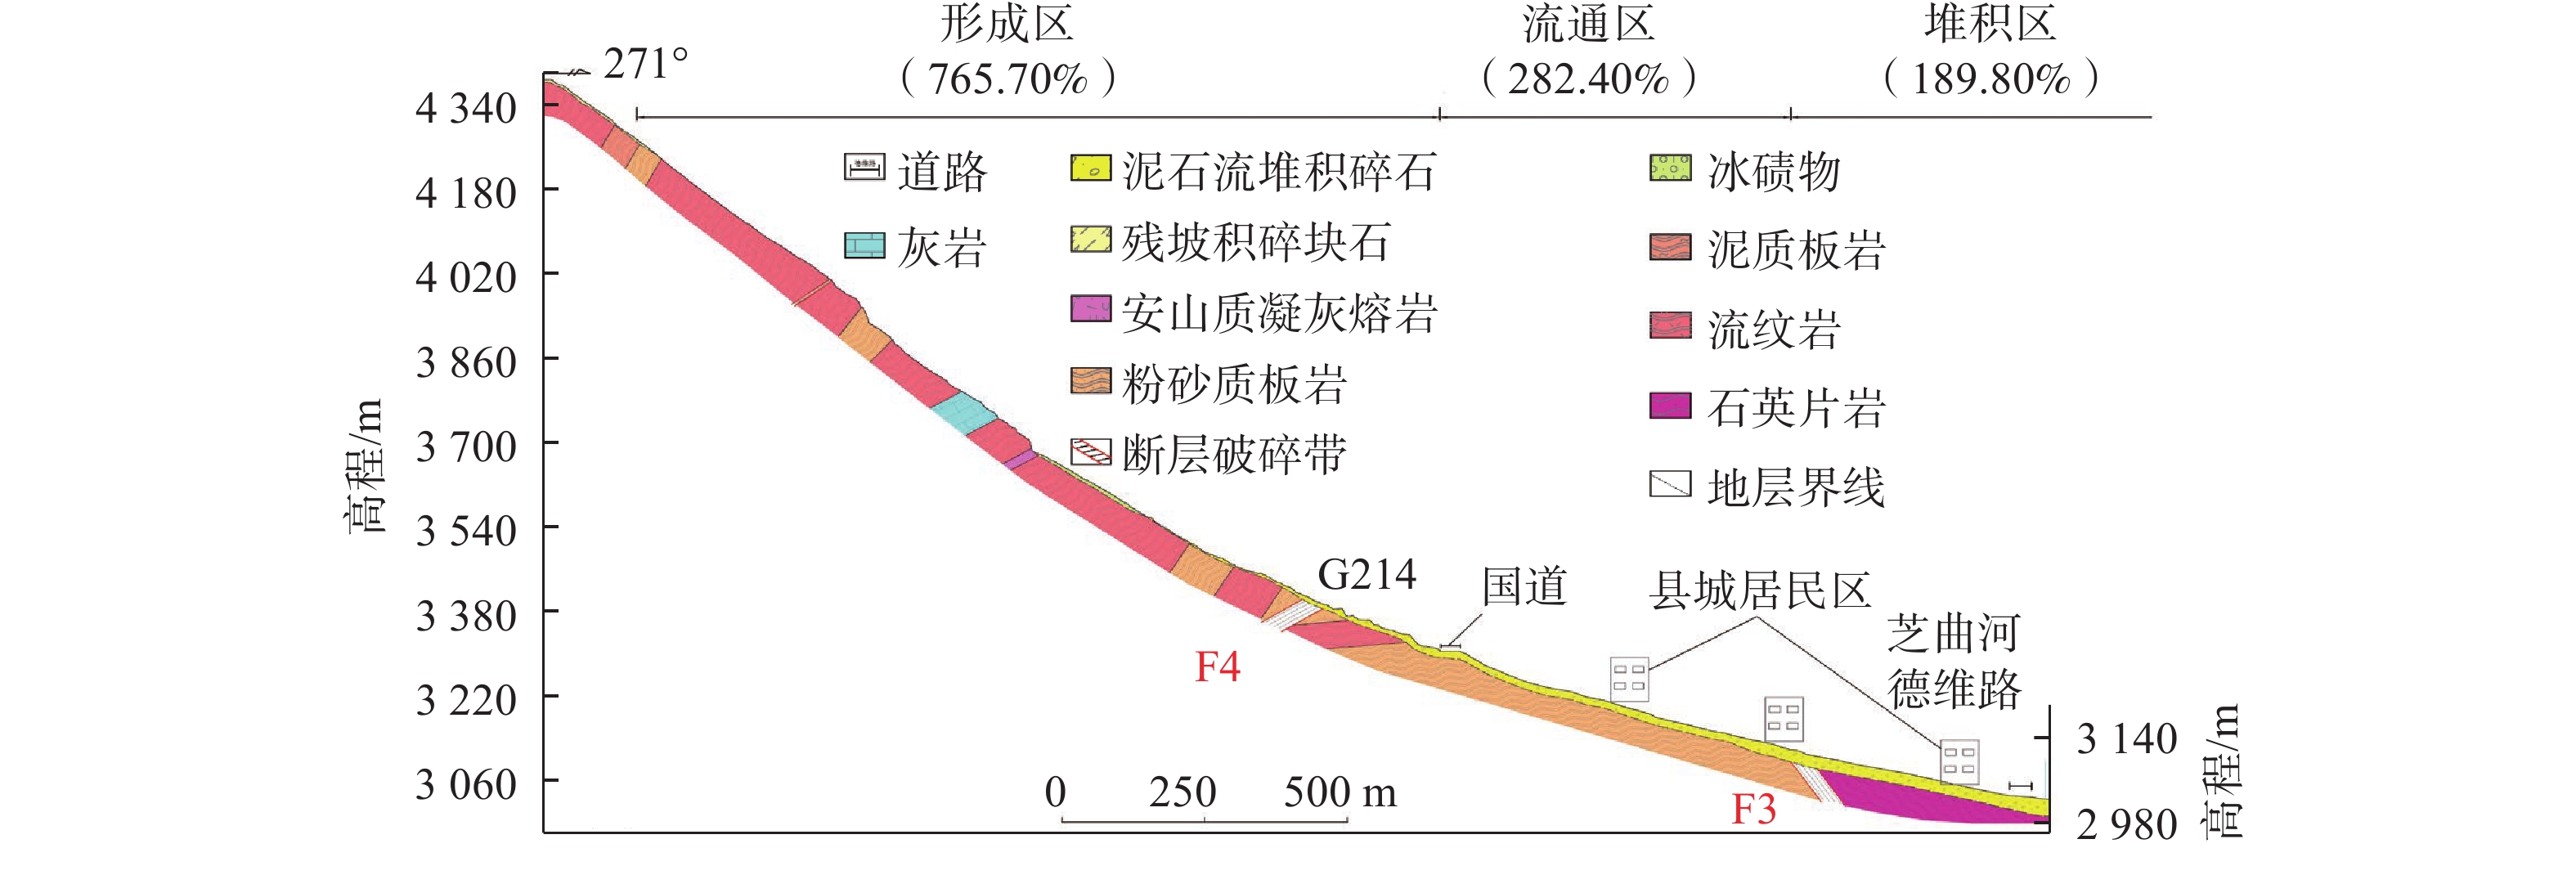
![]()
图 3 一中河泥石流沟A—A'纵剖面图
Figure 3. Longitudinal profile of A—A' section of Yizhong River debris flow gully
![]()
图 5 一中河泥石流灾害成灾机制示意图
Figure 5. Schematic diagram of disaster mechanism of Yizhong River debris flow
![]()
图 6 暴雨+地震极端工况下一中河泥石流模拟结果
Figure 6. Simulation results of Yizhong River debris flow under extreme conditions of heavy rainfall and earthquake
表 1 一中河泥石流物源统计表
Table 1 Statistical table of sources of Yizhong River debris flow
物源类型 冰碛物 滑坡 危岩崩塌 沟床堆积物 沟岸坍塌 坡面侵蚀 合计 面积/(104 m2) 4.0 4.30 10.94 1.24 0.30 31.20 51.98 体积/(104 m3) 30.0 40.12 27.25 3.70 0.80 12.25 114.12 可移储量/(104 m3) 2.75 9.52 8.98 1.95 0.80 1.23 25.23 一次最大可移储量/(104 m3) 0.14 0.55 0.90 0.39 0.24 0.12 2.34  下载: 导出CSV
-
[1] 刘希林,唐川. 泥石流危险性评价[M]. 北京:科学出版社,1995. [LIU Xilin,TANG Chuan. Danger assessment on debris flow[M]. Beijing:Science Press,1995. (in Chinese)] LIU Xilin, TANG Chuan. Danger assessment on debris flow[M]. Beijing: Science Press, 1995. (in Chinese)
[2] 殷跃平. 链状地质灾害的特征与防范应对[J]. 中国地质灾害与防治学报,2017,28(3):3. [YIN Yueping. Characteristics of chain geological disasters and countermeasures[J]. The Chinese Journal of Geological Hazard and Control,2017,28(3):3. (in Chinese with English abstract)] YIN Yueping. Characteristics of chain geological disasters and countermeasures[J]. The Chinese Journal of Geological Hazard and Control, 2017, 28(3): 3. (in Chinese with English abstract)
[3] 于国强,张霞,顾小凡,等. 基底侵蚀作用对黄土坡面泥流动力过程影响机制研究[J/OL]. 中国地质,(2024-07-05)[2024-07-28]. [YU Guoqiang,ZHANG Xia,GU Xiaofan,et al. Influence of the basal erosion on kinetic process of loess slope debris flow[J/OL]. Geology in China,(2024-07-05)[2024-07-28]. http://kns.cnki.net/kcms/detail/11.1167.p.20240704.1646.002.html. (in Chinese with English abstract)] YU Guoqiang, ZHANG Xia, GU Xiaofan, et al. Influence of the basal erosion on kinetic process of loess slope debris flow[J/OL]. Geology in China, (2024-07-05)[2024-07-28]. http://kns.cnki.net/kcms/detail/11.1167.p.20240704.1646.002.html. (in Chinese with English abstract)
[4] 乔成,欧国强,潘华利,等. 泥石流数值模拟方法研究进展[J]. 地球科学与环境学报,2016,38(1):134 − 142. [QIAO Cheng,OU Guoqiang,PAN Huali,et al. Review on numerical modeling methods of debris flow[J]. Journal of Earth Sciences and Environment,2016,38(1):134 − 142. (in Chinese with English abstract)] QIAO Cheng, OU Guoqiang, PAN Huali, et al. Review on numerical modeling methods of debris flow[J]. Journal of Earth Sciences and Environment, 2016, 38(1): 134 − 142. (in Chinese with English abstract)
[5] 王俊豪,管建军,魏云杰,等. 德钦县城直溪河泥石流成灾模式及运动过程模拟[J]. 水文地质工程地质,2021,48(6):187 − 195. [WANG Junhao,GUAN Jianjun,WEI Yunjie,et al. A study of the disaster model and movement process simulation of debris flow in the Zhixi River of Deqin County[J]. Hydrogeology & Engineering Geology,2021,48(6):187 − 195. (in Chinese with English abstract)] WANG Junhao, GUAN Jianjun, WEI Yunjie, et al. A study of the disaster model and movement process simulation of debris flow in the Zhixi River of Deqin County[J]. Hydrogeology & Engineering Geology, 2021, 48(6): 187 − 195. (in Chinese with English abstract)
[6] 宋兵,沈军辉,李金洋,等. RAMMS在泥石流运动模拟中的应用——以白沙沟泥石流为例[J]. 泥沙研究,2018,43(1):32 − 37. [SONG Bing,SHEN Junhui,LI Jinyang,et al. Application of RAMMS model on simulation of debris flow in the Baisha Gully[J]. Journal of Sediment Research,2018,43(1):32 − 37. (in Chinese with English abstract)] SONG Bing, SHEN Junhui, LI Jinyang, et al. Application of RAMMS model on simulation of debris flow in the Baisha Gully[J]. Journal of Sediment Research, 2018, 43(1): 32 − 37. (in Chinese with English abstract)
[7] 熊冲冲,胡卸文,刘丁毅,等. 基于RAMMS锄头沟泥石流运动过程模拟[J]. 四川地质学报,2021,41(1):107 − 111. [XIONG Chongchong,HU Xiewen,LIU Dingyi,et al. Simulation of debris flow activity in the Chutou gully based on RAMMS[J]. Acta Geologica Sichuan,2021,41(1):107 − 111. (in Chinese with English abstract)] XIONG Chongchong, HU Xiewen, LIU Dingyi, et al. Simulation of debris flow activity in the Chutou gully based on RAMMS[J]. Acta Geologica Sichuan, 2021, 41(1): 107 − 111. (in Chinese with English abstract)
[8] 段学良,马凤山,郭捷,等. 基于Massflow模型的西藏仁布杰仲沟泥石流运动特征分析[J]. 中国地质灾害与防治学报,2019,30(6):25 − 33. [DUAN Xueliang,MA Fengshan,GUO Jie,et al. Movement characteristics of Jiezhonggou debris flow of Renbu,Tibet based on massflow model[J]. The Chinese Journal of Geological Hazard and Control,2019,30(6):25 − 33. (in Chinese with English abstract)] DUAN Xueliang, MA Fengshan, GUO Jie, et al. Movement characteristics of Jiezhonggou debris flow of Renbu, Tibet based on massflow model[J]. The Chinese Journal of Geological Hazard and Control, 2019, 30(6): 25 − 33. (in Chinese with English abstract)
[9] 刘珍. 云南德钦县城泥石流物源汇集模式探讨[J]. 云南地质,2020,39(2):284 − 287. [LIU Zhen. A probe into the convergence model of debris flow in Deqin,Yunnan[J]. Yunnan Geology,2020,39(2):284 − 287. (in Chinese with English abstract)] LIU Zhen. A probe into the convergence model of debris flow in Deqin, Yunnan[J]. Yunnan Geology, 2020, 39(2): 284 − 287. (in Chinese with English abstract)
[10] 王研. 云南省德钦县一中河泥石流形成机制和防治对策[D]. 北京:中国地质大学(北京),2016. [WANG Yan. The forming conditions and engineering revention of Yizhong River debris flow in Yunnan Province Deqin County[D]. Beijing:China University of Geosciences,2016. (in Chinese with English abstract)] WANG Yan. The forming conditions and engineering revention of Yizhong River debris flow in Yunnan Province Deqin County[D]. Beijing: China University of Geosciences, 2016. (in Chinese with English abstract)
[11] 张楠. 舟曲三眼峪沟泥石流灾害形成机理及综合防治研究[D]. 武汉:中国地质大学,2018. [ZHANG Nan. Study on formation mechanism and comprehensive prevention of debris flow disasters in Sanyanyu Valley,Zhouqu[D]. Wuhan:China University of Geosciences,2018. (in Chinese with English abstract)] ZHANG Nan. Study on formation mechanism and comprehensive prevention of debris flow disasters in Sanyanyu Valley, Zhouqu[D]. Wuhan: China University of Geosciences, 2018. (in Chinese with English abstract)
[12] 杨兴国,曹志翔,邢会歌,等. 冰碛土滑坡—泥石流—堰塞湖灾害链发展过程机理与模拟技术研究构想[J]. 工程科学与技术,2022,54(3):1 − 13. [YANG Xingguo,CAO Zhixiang,XING Huige,et al. Research framework of the program:dynamic evolution mechanism and simulation of moraine landslide —debris flow —dammed lake disaster chain[J]. Advanced Engineering Sciences,2022,54(3):1 − 13. (in Chinese with English abstract)] YANG Xingguo, CAO Zhixiang, XING Huige, et al. Research framework of the program: dynamic evolution mechanism and simulation of moraine landslide —debris flow —dammed lake disaster chain[J]. Advanced Engineering Sciences, 2022, 54(3): 1 − 13. (in Chinese with English abstract)
[13] 王翔弘绅,胡桂胜,杨志全,等. 云南维西哈达沟中频泥石流特征及堵溃危险性分析[J]. 中国地质灾害与防治学报,2023,34(2):42 − 52. [WANG Xianghongshen,HU Guisheng,YANG Zhiquan,et al. Characteristics of intermediate frequency debris flow and analysis of the hazard of blockage in Hada gully,Weixi County of Yunnan Province[J]. The Chinese Journal of Geological Hazard and Control,2023,34(2):42 − 52. (in Chinese with English abstract)] WANG Xianghongshen, HU Guisheng, YANG Zhiquan, et al. Characteristics of intermediate frequency debris flow and analysis of the hazard of blockage in Hada gully, Weixi County of Yunnan Province[J]. The Chinese Journal of Geological Hazard and Control, 2023, 34(2): 42 − 52. (in Chinese with English abstract)
[14] 赵聪,梁京涛,铁永波,等. 西藏雅鲁藏布江峡谷特大巨型泥石流活动与泥沙输移特征研究[J]. 中国地质灾害与防治学报,2024,35(4):45 − 55. [ZHAO Cong,LIANG Jingtao,TIE Yongbo,et al. Study on the activities of the massive debris flows and sediment transport characteristics in the Grand Bend of the Yarlung Zangbo River Gorge, Xizang[J]. The Chinese Journal of Geological Hazard and Control,2024,35(4):45 − 55. (in Chinese with English abstract)] ZHAO Cong, LIANG Jingtao, TIE Yongbo, et al. Study on the activities of the massive debris flows and sediment transport characteristics in the Grand Bend of the Yarlung Zangbo River Gorge, Xizang[J]. The Chinese Journal of Geological Hazard and Control, 2024, 35(4): 45 − 55. (in Chinese with English abstract)
[15] 袁东, 张广泽, 王栋, 等. 西部山区交通廊道泥石流发育特征及选线对策[J]. 地质通报,2023,42(5):743 − 752. [YUAN Dong, ZHANG Guangze, WANG Dong, et al. Analysis on development characteristics of debris flow and route selection countermeasures along the traffic lines in mountain areas of Western China[J]. Geological Bulletin of China,2023,42(5):743 − 752. (in Chinese with English abstract)] YUAN Dong, ZHANG Guangze, WANG Dong, et al. Analysis on development characteristics of debris flow and route selection countermeasures along the traffic lines in mountain areas of Western China[J]. Geological Bulletin of China, 2023, 42(5): 743 − 752. (in Chinese with English abstract)
[16] 杨强,王高峰,李金柱,等. 白龙江中上游泥石流形成条件与成灾模式探讨[J]. 中国地质灾害与防治学报,2022,33(6):70 − 79. [YANG Qiang,WANG Gaofeng,LI Jinzhu,et al. Formation conditions and the disaster modes of debris flows along middle and upper reaches of the Bailongjiang River Basin[J]. The Chinese Journal of Geological Hazard and Control,2022,33(6):70 − 79. (in Chinese with English abstract)] YANG Qiang, WANG Gaofeng, LI Jinzhu, et al. Formation conditions and the disaster modes of debris flows along middle and upper reaches of the Bailongjiang River Basin[J]. The Chinese Journal of Geological Hazard and Control, 2022, 33(6): 70 − 79. (in Chinese with English abstract)
[17] 张宪政,铁永波,宁志杰,等. 四川汶川县板子沟“6•26” 特大型泥石流成因特征与活动性研究[J]. 水文地质工程地质,2023,50(5):134 − 145. [ZHANG Xianzheng,TIE Yongbo,NING Zhijie,et al. Characteristics and activity analysis of the catastrophic “6•26” debris flow in the Banzi catchment, Wenchuan County of Sichuan Province[J]. Hydrogeology & Engineering Geology,2023,50(5):134 − 145. (in Chinese with English abstract)] ZHANG Xianzheng, TIE Yongbo, NING Zhijie, et al. Characteristics and activity analysis of the catastrophic “6•26” debris flow in the Banzi catchment, Wenchuan County of Sichuan Province[J]. Hydrogeology & Engineering Geology, 2023, 50(5): 134 − 145. (in Chinese with English abstract)
[18] 庞海松,谢骏锦,张小明,等. 基于RAMMS数值模拟的短时强降雨型泥石流危险性评价[J]. 地质科技通报,2024,43(2):215 − 225. [PANG Haisong,XIE Junjin,ZHANG Xiaoming,et al. Hazard assessment of debris flow induced by short-time heavy rainfall based on RAMMS numerical simulation[J]. Bulletin of Geological Science and Technology,2024,43(2):215 − 225. (in Chinese with English abstract)] PANG Haisong, XIE Junjin, ZHANG Xiaoming, et al. Hazard assessment of debris flow induced by short-time heavy rainfall based on RAMMS numerical simulation[J]. Bulletin of Geological Science and Technology, 2024, 43(2): 215 − 225. (in Chinese with English abstract)
[19] 史继帅,姜亮,翟胜强. 四川甘洛县黑西洛沟“8•31” 泥石流动力过程[J]. 中国地质灾害与防治学报,2024,35(3):52 − 60. [SHI Jishuai,JIANG Liang,ZHAI Shengqiang. Dynamic process of the “8•31” debris flow in Luoxi gulley of Ganluo County, Sichuan Province[J]. The Chinese Journal of Geological Hazard and Control,2024,35(3):52 − 60. (in Chinese with English abstract)] SHI Jishuai, JIANG Liang, ZHAI Shengqiang. Dynamic process of the “8•31” debris flow in Luoxi gulley of Ganluo County, Sichuan Province[J]. The Chinese Journal of Geological Hazard and Control, 2024, 35(3): 52 − 60. (in Chinese with English abstract)
[20] 蒋涛,崔圣华,许向宁,等. 基于遥感解译的典型强震区泥石流物源发育及演化——以四川都汶高速沿线为例[J]. 地质通报,2024,43(7):1243 − 1254. [JIANG Tao, CUI Shenghua, XU Xiangning, et al. Distribution and evolution of debris flow in a typic meizoseismal area based on remote sensing: A case study of the Sichuan Duwen Expressway[J]. Geological Bulletin of China,2024,43(7):1243 − 1254. (in Chinese with English abstract)] JIANG Tao, CUI Shenghua, XU Xiangning, et al. Distribution and evolution of debris flow in a typic meizoseismal area based on remote sensing: A case study of the Sichuan Duwen Expressway[J]. Geological Bulletin of China, 2024, 43(7): 1243 − 1254. (in Chinese with English abstract)


计量
- 文章访问数: 124
- HTML全文浏览量: 10
- PDF下载量: 64
 邮件订阅
邮件订阅 RSS
RSS